
Figures & data
Table 1 Comparison of the Clinical and Histologic Features Between the Patients with Proliferative LN and Membranous LN
Figure 1 MPC1 expression in kidney tissues of LN. Representative immunohistochemical staining of MPC1 in proliferative LN ((A), n=18), and membranous LN ((B), n=18) groups, respectively. Left column (Magnification×100). Right two columns (Magnification×400). (C) shows a comparison of quantitative analysis of MPC1 expression between proliferative LN and membranous LN using Image-Pro Plus 6.0 software.
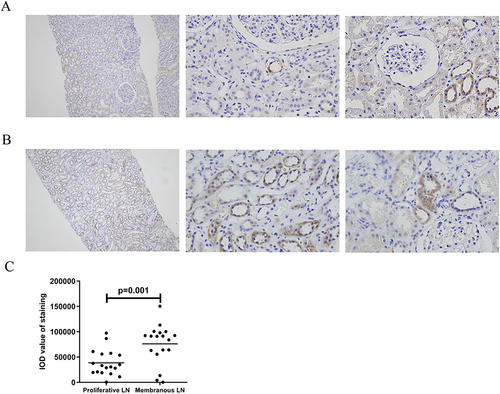
Figure 2 MPC2 expression in kidney tissues of LN. Representative immunohistochemical staining of MPC2 in proliferative LN ((A), n=18), and membranous LN ((B), n=18) groups, respectively. Left column (Magnification×100). Right two columns (Magnification×400). (C) shows a comparison of quantitative analysis of MPC2 expression between proliferative LN and membranous LN using Image-Pro Plus 6.0 software.
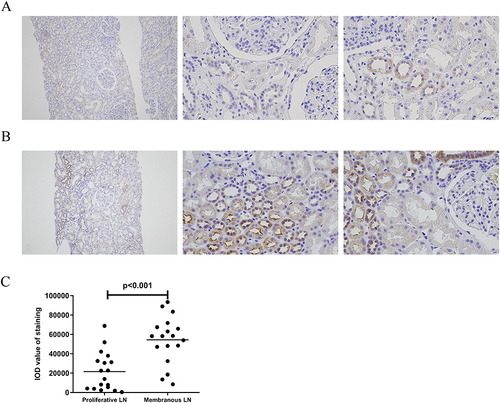
Table 2 Associations Between MPC and Features of Lupus Nephritis (n=36)
Data Sharing Statement
The datasets analyzed during the current study are available from the corresponding author on reasonable request.