Figures & data
Figure 1 Sequence analysis of the pedigree and in vitro splicing experiments (a) pedigree of the Chinese family with XLAS. Black filled symbols represent affected individuals; The symbols with a slash correspond to deceased individuals; Arrow indicates the proband; M represent mutation (c.321+5G>A), N represent normal, / indicate not detect. (b) Sanger sequencing of the proband and his parents. (c) Electrophoresis for amplification of COL4A5 cDNA from the skin tissue of healthy individual and proband. (d) Schematic overview of the region harboring c.321+5G>A mutation in COL4A5 and representation of the abnormal splicing. Representation of the alternative splicing of exon 5 in COL4A5. (e) Sequencing chromatogram of COL4A5 wild-type cDNA and splice variants.
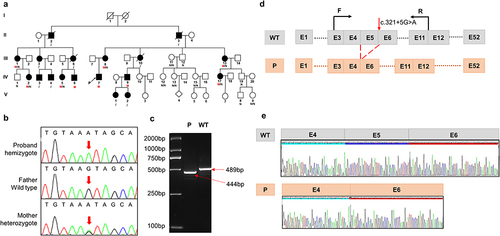
Table 1 Clinical Data of Patients with the COL4A5 Gene Variant
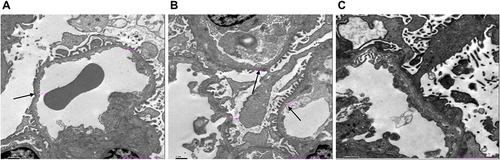
Figure 2 Electron microscopy images of his kidney of IV-6 (A-C) show two glomeruli under electron microscopy. Electron microscopy of renal showed glomerular capillary endothelial cells, renal tubular epithelial cells, and visceral epithelial cells with vacuolar degeneration; segmental fusion of foot processes; irregular with an uneven density of glomerular basement membrane thickness. The black arrow indicates an abnormally thick basement membrane.