
Figures & data
Table 1 Description of the study population
Table 2 Comparison of different variables between dialysis patients and transplant recipients
Figure 1 Mean iPTH (ng/L) levels before and after surgery in dialysis and transplant groups.
Abbreviation: iPTH, intact parathyroid hormone.
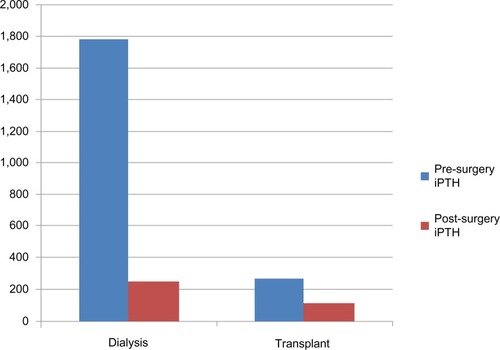
Figure 2 Comparison between dialysis and transplant patients of mean oral and intravenous elemental calcium (g) administered after parathyroidectomy per patient during hospital admission (P<0.001).
Abbreviations: IV, intravenous; Ca, calcium.
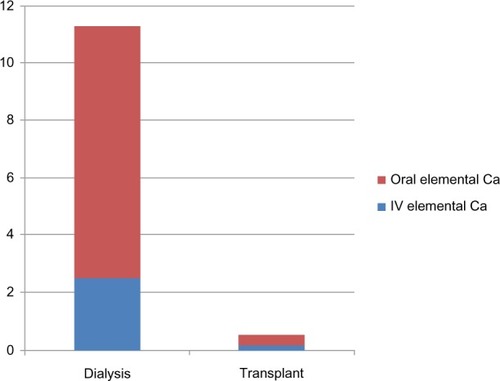
Figure 3 Comparison of length of admission (days) between dialysis and transplant patients (P<0.001).
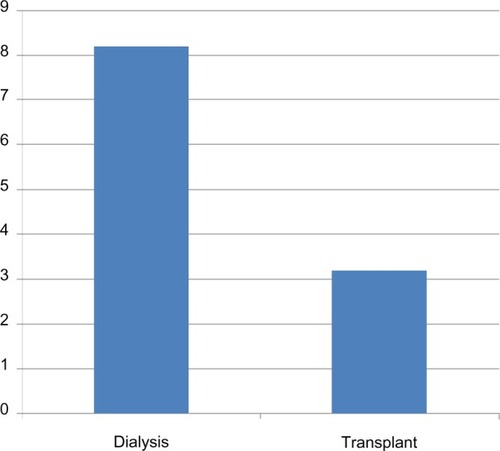
Table 3 Spearman correlation of predictors of severe hungry bone syndrome