Figures & data
Figure 1 Classification of hemodialysis patients into phosphate variability groups.
Note: Classification was based on the magnitude and variation of monthly mean serum phosphate levels determined over 6 months (months 4–9) following the initiation of hemodialysis.
Abbreviations: cH, consistently high; cL, consistently low; cT, consistently target; HL, high-to-low; HT, high-to-target; TL, target-to-low.
Abbreviations: cH, consistently high; cL, consistently low; cT, consistently target; HL, high-to-low; HT, high-to-target; TL, target-to-low.
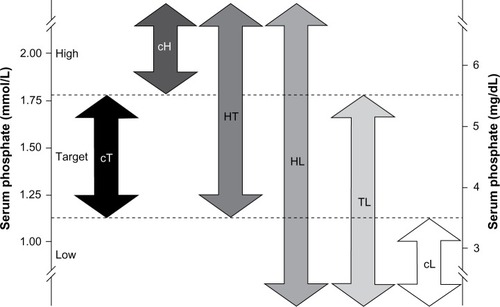
Table 1 Baseline demographic and clinical characteristics
Figure 2 Baseline characteristics by phosphate variability group.
Notes: (A) mean age; (B) mean serum phosphate; (C) mean Charlson comorbidity index; (D) mean serum intact PTH; (E) proportion of patients with intact PTH ≤600 pg/mL; (F) proportion of patients receiving a phosphate binder. *P<0.01; **P<0.001; ***P<0.0001 compared with the cT group using the analysis of variance (ANOVA) F-test for continuous variables and the chi-squared test for categorical variables. The dashed line indicates the cT group value.
Abbreviations: cH, consistently high; cL, consistently low; cT, consistently target; HL, high-to-low; HT, high-to-target; PTH, parathyroid hormone; SD, standard deviation; TL, target-to-low.
Abbreviations: cH, consistently high; cL, consistently low; cT, consistently target; HL, high-to-low; HT, high-to-target; PTH, parathyroid hormone; SD, standard deviation; TL, target-to-low.
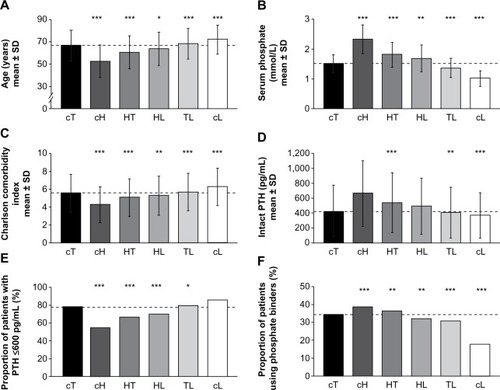
Table 2 Baseline disease and medication characteristics
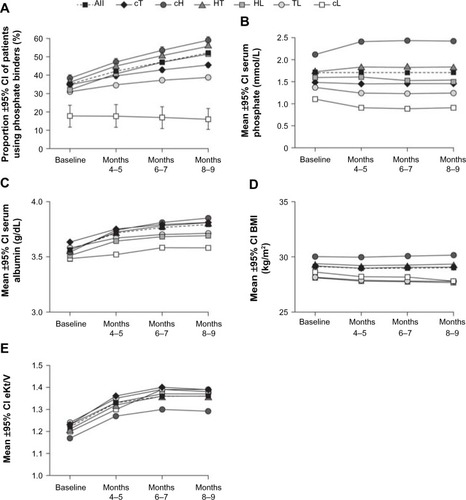
Figure 3 Trends in characteristics of the phosphate variability groups over time.
Notes: (A) proportion of patients using a phosphate binder; (B) mean serum phosphate level; (C) mean albumin; (D) mean BMI; (E) mean eKt/V. Owing to the large sample sizes, CIs are not visible for most data points because the bounds are very close to the means.
Abbreviations: BMI, body mass index; cH, consistently high; CI, confidence interval; cL, consistently low; cT, consistently target; eKt/V, equilibrated fractional clearance of body water of urea; HL, high-to-low; HT, high-to-target; TL, target-to-low.
Abbreviations: BMI, body mass index; cH, consistently high; CI, confidence interval; cL, consistently low; cT, consistently target; eKt/V, equilibrated fractional clearance of body water of urea; HL, high-to-low; HT, high-to-target; TL, target-to-low.