
Figures & data
Figure 1 The flow of patients.
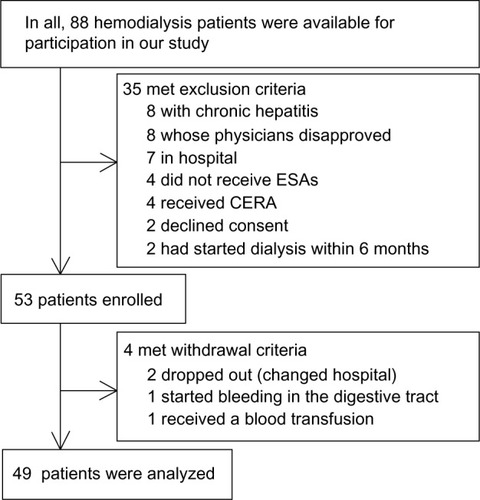
Figure 2 Blood test schedule.
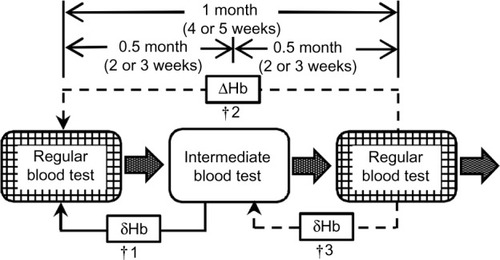
Figure 3 Iron algorithm.
Abbreviations: Hb, hemoglobin (g/dL); ΔHb: Hb changes for 1 month (g/dL): ESA, erythropoiesis-stimulating agent.
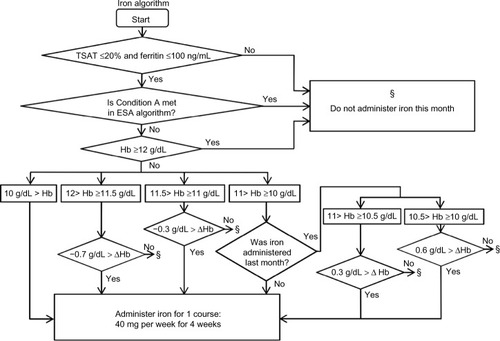
Figure 4 First flow chart of erythropoiesis-stimulating agent (ESA) algorithm.
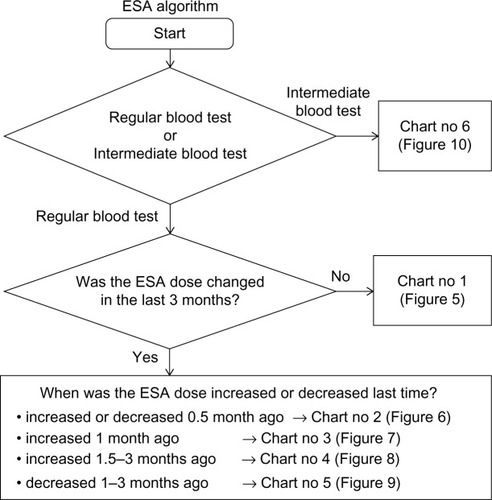
Figure 5 Chart number 1: The erythropoiesis-stimulating agent dose had not been changed for the last 3 months. Each chart (Chart nos 1–6; –) was more sensitive to hemoglobin (Hb) decreases than to Hb increases except when the Hb value was high, because other than deficiency of erythropoiesis-stimulating agent doses and iron, there may have been myriad causes that led to decreases in Hb values.
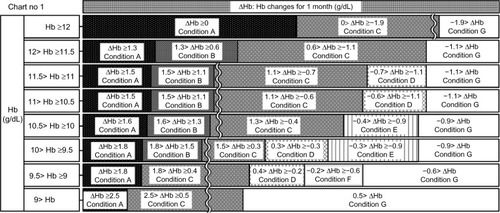
Figure 6 Chart number 2: The erythropoiesis-stimulating agent dose was increased or decreased 0.5 month ago. This chart was used to monitor hemoglobin (Hb) changes at the 0.5-month mark and was created for monitoring short-term Hb increases or decreases.
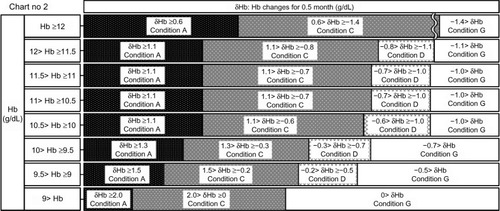
Figure 7 Chart number 3: The erythropoiesis-stimulating agent (ESA) dose was increased 1 month ago. Compared with Chart number 1 (), this chart was more sensitive to hemoglobin (Hb) decreases when the Hb value was ≥9 g/dL and more permissive to Hb increases when Hb values ranged from ≥9 to <11.5 g/dL, because the Hb value may increase partially because of an increase in ESA; however, our ESA algorithm could watch for unexpected Hb decreases.
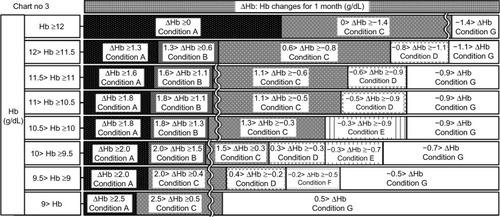
Figure 8 Chart number 4: The erythropoiesis-stimulating agent (ESA) dose was increased 1.5–3 months ago. Compared with Chart number 3 (), this chart was more sensitive to hemoglobin (Hb) decreases when Hb values ranged from ≥9 to <11 g/dL because the Hb value should increase fully because of an increase in ESA. Our ESA algorithm could watch for unexpected Hb decreases.
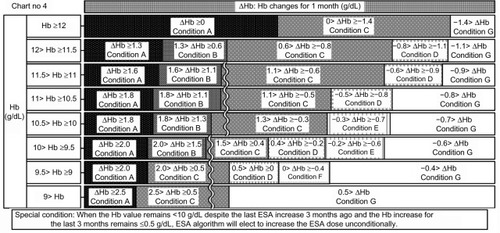
Figure 9 Chart number 5: The erythropoiesis-stimulating agent (ESA) dose was decreased 1–3 months ago. Compared with Chart number 1 (), this chart was more sensitive to hemoglobin (Hb) increases when Hb values ranged from ≥11 to <12 g/dL, more sensitive to Hb decreases when Hb values ranged from ≥9 to <11 g/dL, and more permissive to Hb decreases when Hb values ranged from ≥11.5 to <12 g/dL, because the Hb value should decrease because of a decrease in ESA. Our ESA algorithm could watch for unexpected Hb increases and excessive Hb decreases.
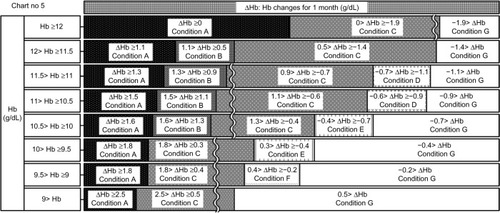
Figure 10 Chart number 6: Intermediate blood tests. This chart was used to monitor hemoglobin (Hb) changes at the 0.5-month mark and was created for monitoring short-term Hb increases or decreases.
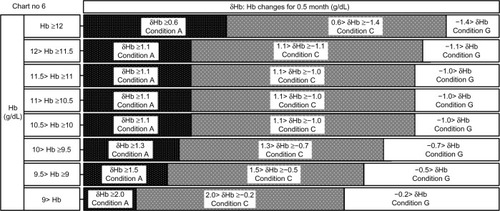
Figure 11 Decision table.
Abbreviation: ESA, erythropoiesis-stimulating agent.
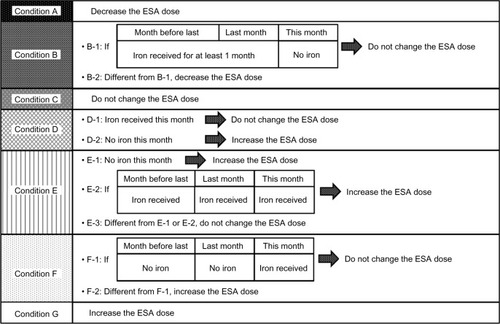
Figure 12 Erythropoiesis-stimulating agent dose adjustment worksheet.
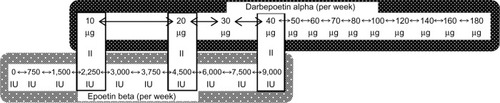
Table 1 Baseline characteristics
Figure 13 Trend in mean hemoglobin values ± standard deviation at regular blood tests.
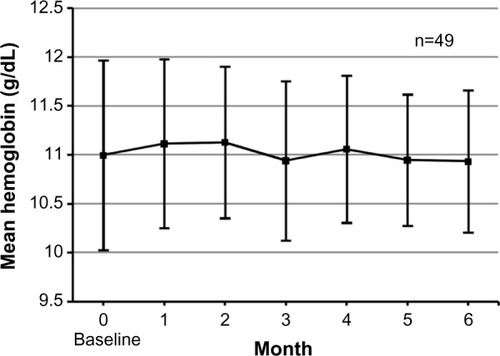
Figure 14 Percentage of patients in the target hemoglobin (Hb) range of 10–12 g/dL and the trend in the Hb standard deviation at regular blood tests.
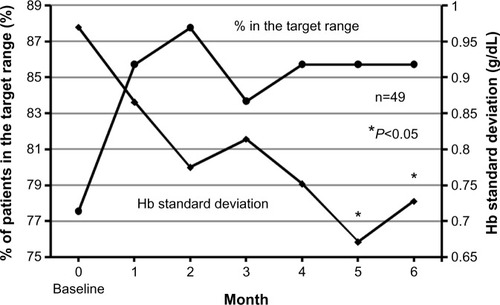
Table 2 Comparisons between baseline data (0 month) and data at the end of our study (6 months)