Figures & data
Table 1 CT scan scoring system by Tarzi et al
Table 2 Cut-off values for a positive CT scan, using the CT scan scoring parameters of Vlijm et al
Table 3 Clinical data of study population
Figure 1 Cross-sectional abdominal CT images of EPS Type I–III patients.
Notes: In EPS Type I (A–D), only mild peritoneal calcification (thin arrows in B), extensive loculated ascites (thick arrows in A–D), air entrapment in ascites (thick arrow in D, no intestinal perforation was detected during PEEL surgery), and adhesions of bowel loops with bowel wall thickening and dilatation are observed (A). CM enhancement of the peritoneum (thin arrows in C). EPS Type II (E–F) is showing adhesions of bowel loops with bowel wall thickening and dilatation (thick arrow in E) and loculated ascites (thin arrows in E), bowel tethering (thick arrow in F) and bowel dilatation (thin arrow in F). In EPS Type III (G–I), extensive calcification of the peritoneal membrane (G and H), including free-flowing ascites (thick arrows in G and H), and extensive peritoneal thickening (thin arrows in I) exist.
Abbreviations: CT, computed tomography; EPS, encapsulating peritoneal sclerosis; PEEL, peritonectomy and enterolysis; CM, contrast medium.
Abbreviations: CT, computed tomography; EPS, encapsulating peritoneal sclerosis; PEEL, peritonectomy and enterolysis; CM, contrast medium.
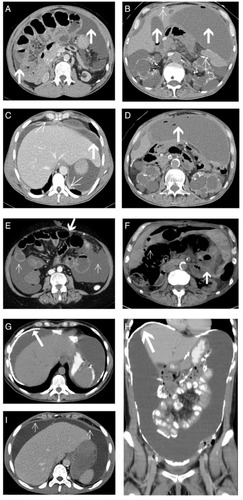
Table 4 Results of the CT scoring system in our study population using both established CT scoring systems
Table 5 CT findings in different macroscopic phenotypes of EPS (n=30)
Figure 2 CT score of patients with different macroscopic phenotypes (mean ± SD) and CRP levels (median with IQR) in patients with EPS Type I–III.
Notes: Using the CT scoring system by Tarzi et alCitation28 (A); and the CT scoring system by Vlijm et alCitation29 (B).
Abbreviations: CT, computed tomography; SD, standard deviation; CRP, C-reactive protein; IQR, interquartile range; EPS, encapsulating peritoneal sclerosis.
Abbreviations: CT, computed tomography; SD, standard deviation; CRP, C-reactive protein; IQR, interquartile range; EPS, encapsulating peritoneal sclerosis.
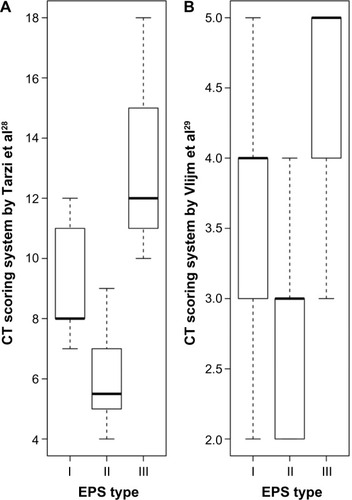
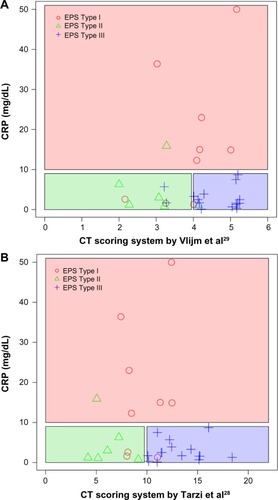
Figure 3 Prediction of the macroscopic phenotype based on the CT scores
Notes: Using the CT scoring system by Vlijm et alCitation29 (A) and the CT scoring system by Tarzi et alCitation28 (B) in combination with CRP values.
Abbreviations: CT, computed tomography; CRP, C-reactive protein; EPS, encapsulating peritoneal sclerosis.
Abbreviations: CT, computed tomography; CRP, C-reactive protein; EPS, encapsulating peritoneal sclerosis.