
Figures & data
Figure 1 Box plot comparing serum zinc levels before and after zinc supplementation in the supplemented group.
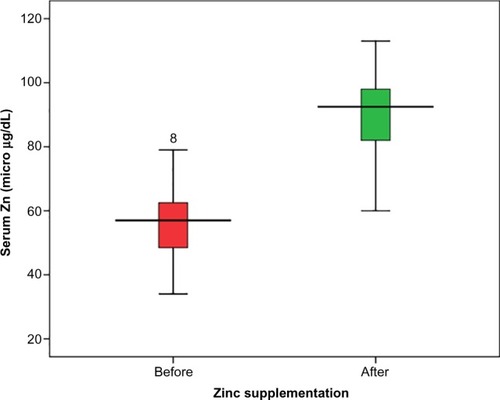
Table 1 Mean ± SD of serum zinc, serum leptin, body weight, and BMI in both the studied groups
Table 2 Correlation between serum zinc level and the studied variables after intervention in the study group
Table 3 Mean ± SD of serum zinc, serum leptin, and body mass index in males and females in group I (supplemented group)
Table 4 Stepwise multiple linear regression analysis for factors affecting zinc level