
Figures & data
Figure 1 CONSORT diagram showing a flow of subjects in the study.
Abbreviation: CONSORT, CONsolidated Standards of Reporting Trials.
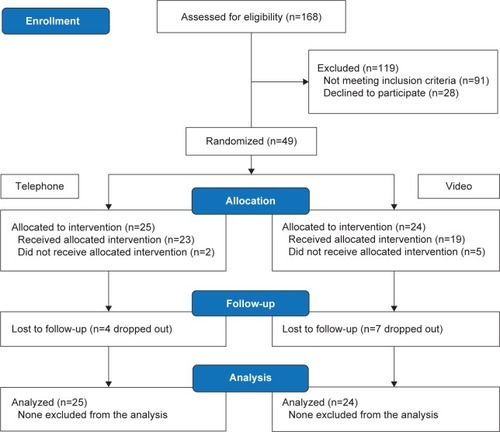
Table 1 Baseline characteristics of the groups
Figure 2 Kaplan–Meier survival curve of days of abstinence between the two arms.
Note: Log-rank test χ2 =0.13, P=0.72.
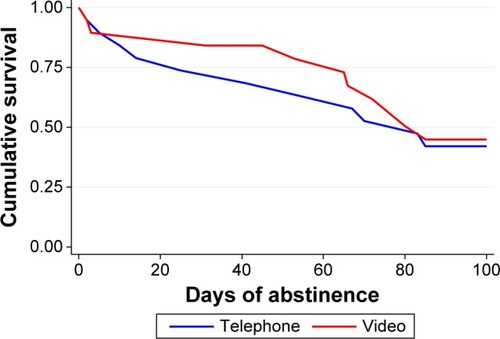
Table 2 Seven-day point-prevalence abstinence by intervention condition