
Figures & data
Figure 1 Flowchart of the study.
Note: *Seven participants were excluded on account of an MRS <20.
Abbreviations: PL, placebo; NUT, nutraceutics; SBP, systolic blood pressure; DBP, diastolic blood pressure; HR, heart rate; HDL, high-density lipoprotein; LDL, low-density lipoprotein; MRS, Menopause Rating Scale.
Abbreviations: PL, placebo; NUT, nutraceutics; SBP, systolic blood pressure; DBP, diastolic blood pressure; HR, heart rate; HDL, high-density lipoprotein; LDL, low-density lipoprotein; MRS, Menopause Rating Scale.
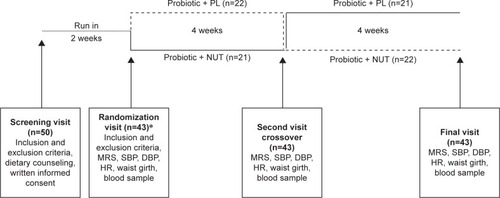
Table 1 Baseline demographic and clinical characteristics of the study population divided by initial treatment
Table 2 MRS score compared from baseline after first-line intervention and second-line intervention
Figure 2 MRS score after placebo and NUT period.
Note: Data obtained with active treatment and placebo were cumulated for the statistical analysis.
Abbreviations: MRS, Menopause Rating Scale; NUT, nutraceutics.
Abbreviations: MRS, Menopause Rating Scale; NUT, nutraceutics.
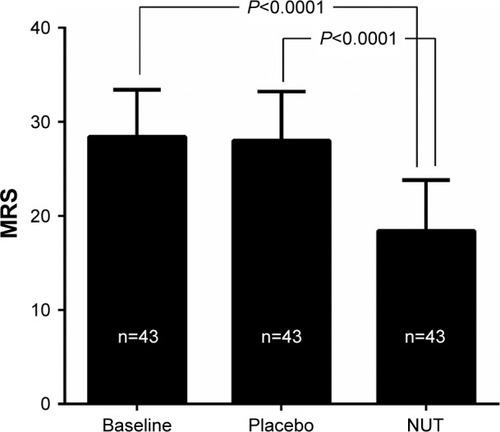
Table 3 MRS divided into different categories of menopausal symptoms at baseline and at the end of the two study periods
Table 4 Blood pressure, lipid, and glucose profile at baseline and at the end of the two study periods