
Figures & data
Figure 1 BIMA flowchart.
Abbreviation: BIMA, Blood Information Management Application.
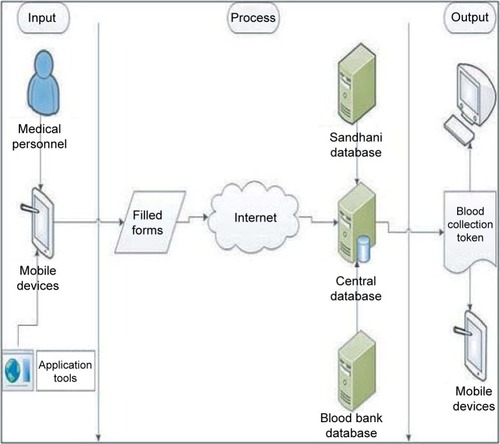
Figure 2 Computer screenshot of blood requisition form from ward.
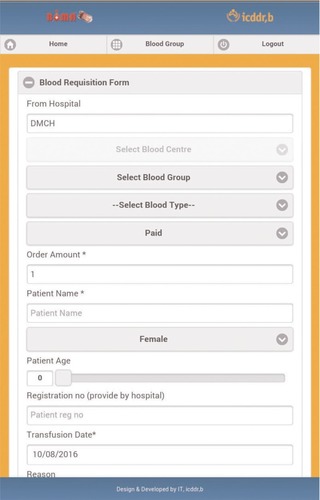
Figure 3 Computer screenshot of BIMA form from blood bank.
Abbreviation: BIMA, Blood Information Management Application.
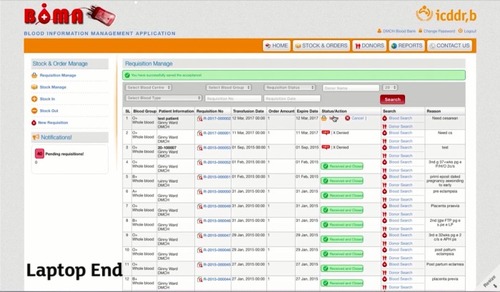
Table 1 General characteristics of the participants
Figure 4 Overall total lag time of blood collection before and after the implementation of BIMA.
Abbreviations: BIMA, Blood Information Management Application; 95% CI, 95% confidence interval.
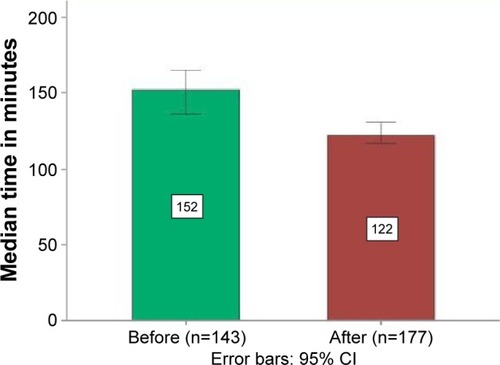
Figure 5 Median transfusion time, by reason, before and after BIMA implementation.
Abbreviations: BIMA, Blood Information Management Application; 95% CI, 95% confidence interval; PIH, pregnancy-induced hypertension; PPH, postpartum hemorrhage.
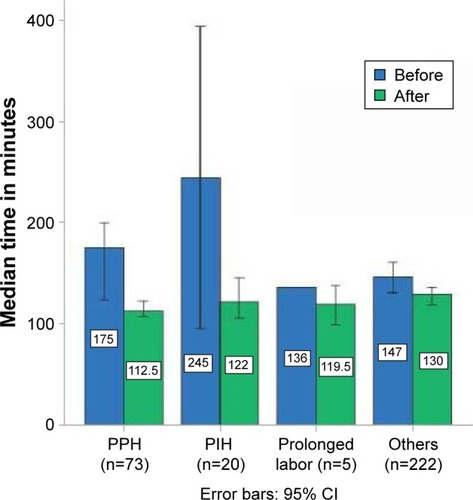
Figure 6 Median time taken by duty roster.
Abbreviation: 95% CI, 95% confidence interval.
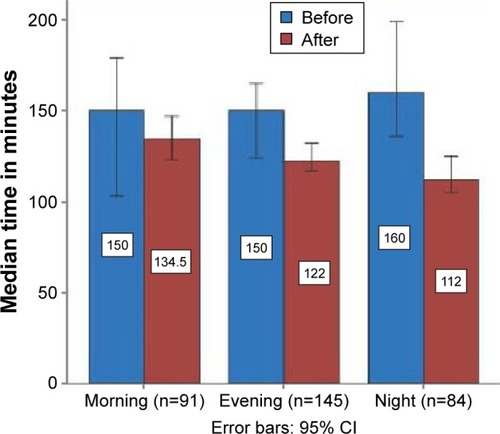
Table 2 Time taken after implementation of BIMA: median linear regression analysis