Figures & data
Table 1 Demographics of study population
Figure 1 Prevalence of uterine fibroids across different age groups in black/African American and white women.
Abbreviation: CI, confidence interval.
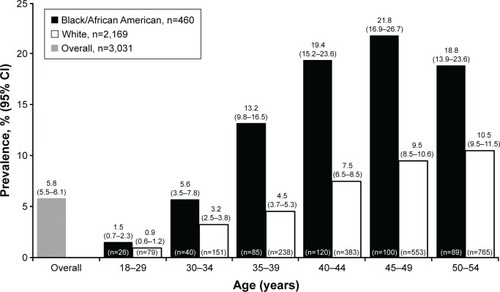
Table 2 Distribution of uterine fibroid-related symptoms ever experienced in patients with uterine fibroids and controls
Table 3 Distribution of uterine fibroid-related symptoms during the 4 weeks before survey administration in patients with uterine fibroids and controls
Table 4 Symptoms’ bothersomeness among uterine fibroid patients
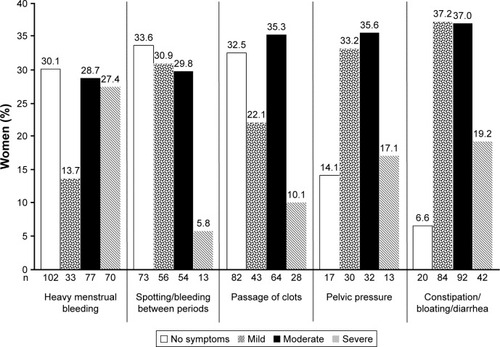
Figure 2 Severity of typical uterine fibroid-related symptoms among respondents who were being treated for uterine fibroids at the time of the survey.