
Figures & data
Figure 1 Preferred process in urogynecology.
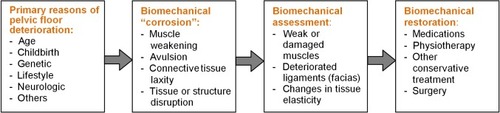
Figure 2 Vaginal tactile imaging probe.
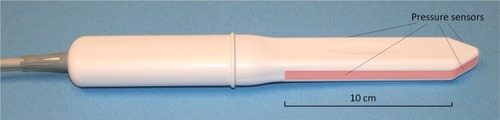
Figure 3 Vaginal tactile imaging probe during pelvic floor examination.
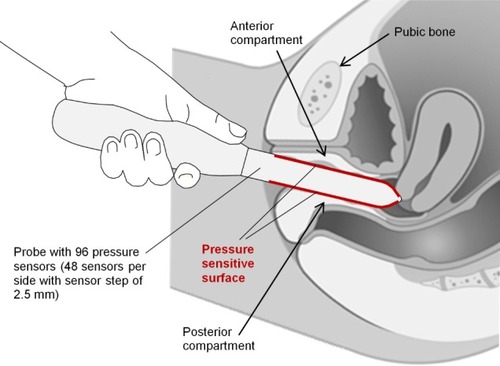
Figure 4 (A) VTI probe insertion to deform vaginal walls in a definitive manner and (B) a tactile image for VTI probe insertion into a silicone model with known elasticity distribution.
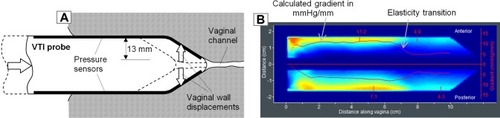
Figure 5 Test 1 (VTI probe insertion) results for two patients with (A) stiff and (B) much softer vaginal tissue.
Abbreviation: VTI, vaginal tactile imaging.
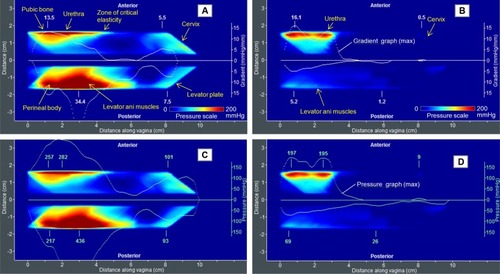
Figure 6 (A) VTI probe elevation to acquire tactile feedback from deep structures and (B) a tactile image for VTI probe elevation inside a silicone model with known elasticity distribution.
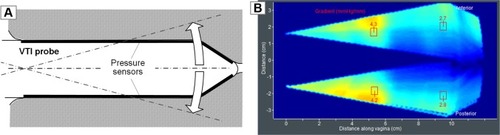
Figure 7 Test 2 (VTI probe elevation) results for two patients with (A; Case A) weak and (B; Case B) strong pelvic floor support.
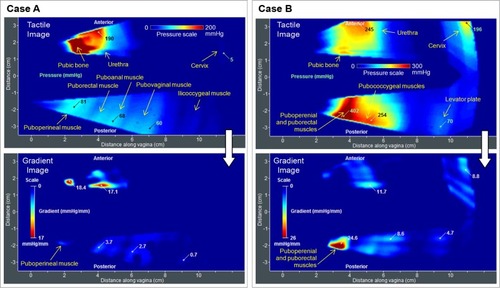
Figure 8 (A) VTI probe rotation to acquire circumferential tactile feedback from the vaginal walls and (B) tactile images acquired inside a silicone model with known elasticity distribution.
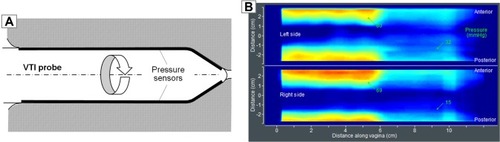
Figure 9 Test 3 (VTI probe rotation) results for two patients with normal pelvic floor support and (A) irregular strong and (B) weak vaginal wall response.
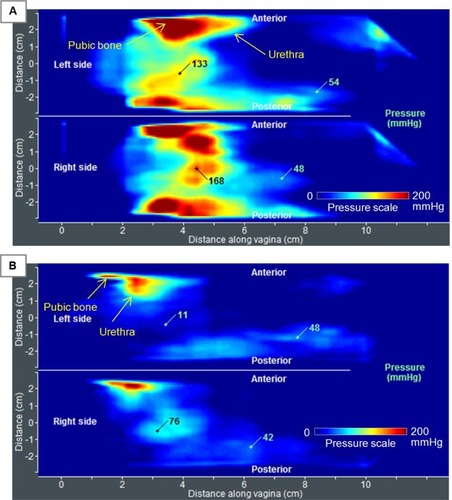
Figure 10 Test 4 (Valsalva maneuver) results for a 51-year-old patient with normal pelvic support.
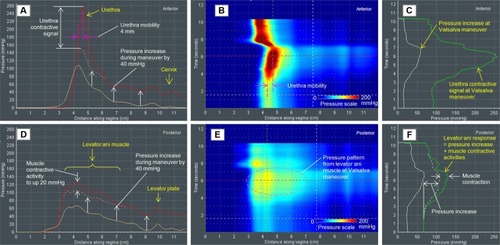
Figure 11 Test 4 (Valsalva maneuver) results for a 52-year-old patient with normal pelvic floor support.
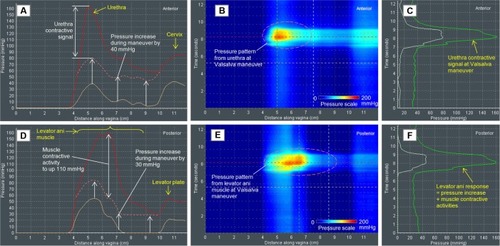
Figure 12 Test 4 (Valsalva maneuver) results for a 66-year-old patient with Stage IV prolapse.
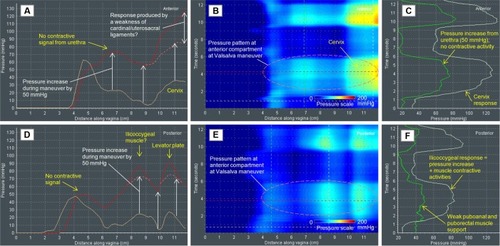
Figure 13 Test 4 (Valsalva maneuver) results for an 84-year-old patient with Stage III prolapse.
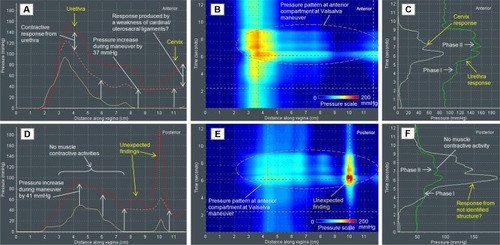
Figure 14 Test 5 (voluntary muscle contraction) results for a 35-year-old patient with normal pelvic floor support.
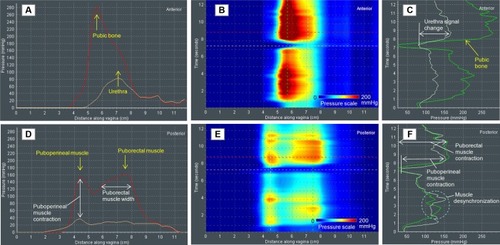
Figure 15 Test 6 (voluntary muscle contraction) results for a 35-year-old patient with normal pelvic floor support.
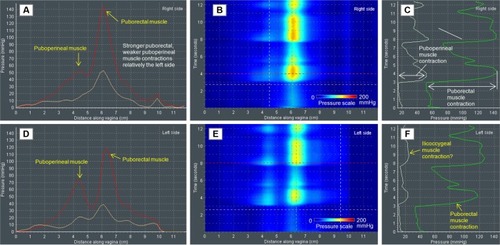
Figure 16 Test 5 (voluntary muscle contraction) results for an 80-year-old patient with Stage II prolapse.
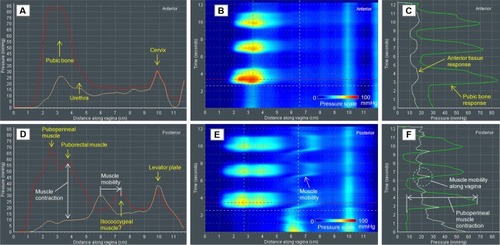
Figure 17 Test 6 (voluntary muscle contraction) results for an 80-year-old patient with Stage II prolapse.
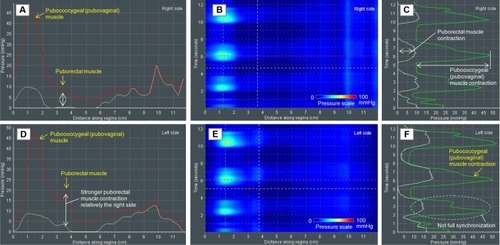
Figure 18 Test 7 (involuntary muscle relaxation) results for a 74-year-old patient with normal pelvic floor support.
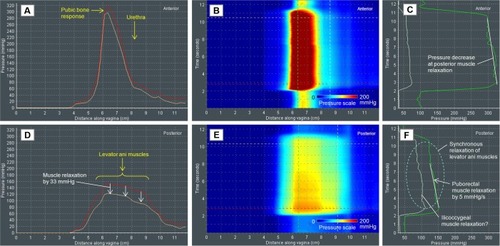
Figure 19 Test 8 (involuntary muscle relaxation) results for a 71-year-old patient with Stage II prolapse.
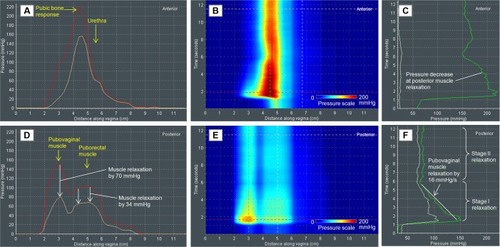
Figure 20 Test 8 (involuntary muscle contraction) results for a 51-year-old patient with normal pelvic floor support.
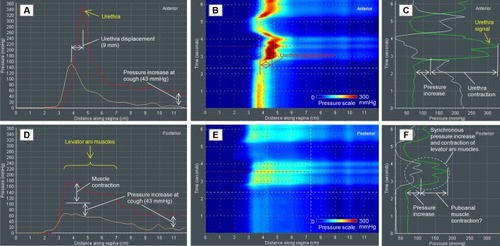
Figure 21 Test 8 (involuntary muscle contraction) results for a 64-year-old patient with Stage IV prolapse.
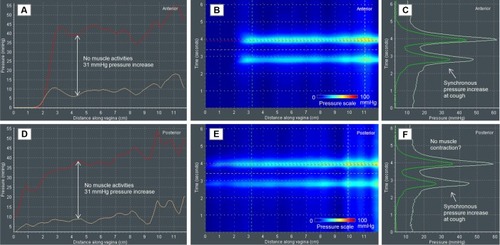
Table 1 VTI parameters, pelvic floor structures, clinical value, and relevant clinical conditions for VTI tests 1–8