Figures & data
Table 1 Distribution of the pregnant women studied, by characteristics and the DHS year
Table 2 Prevalence of ANC utilization and proportion who started ANC visits during first trimester by women characteristics
Table 3 The incidence rate, median survival time, and log-rank test of timing of first ANC visit by selected characteristics and survey years
Table 4 The adjusted risk factors of timing of first ANC visit by selected characteristics and survey years
Figure 1 Proportion attending ANC and proportion who started in the first trimester by survey years.
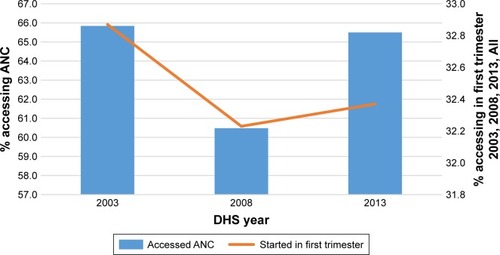
Figure 2 Percentage and cumulative percentage distribution of the month of ANC initiation by survey years.
Abbreviation: ANC, antenatal care.
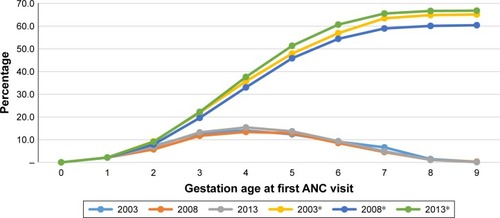
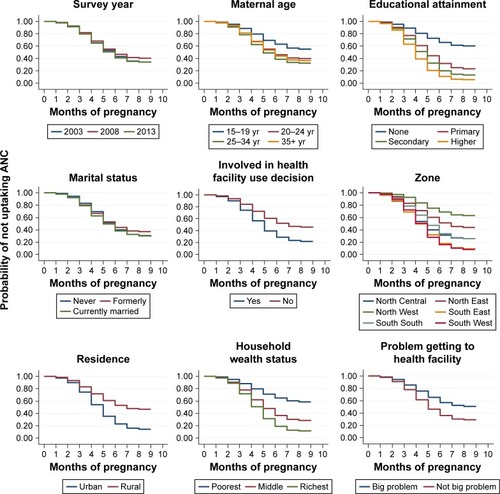
Figure 3 Survival functions of first ANC visit by survey years and respondent characteristics.