
Figures & data
Figure 1 SHD is measured by drawing a line through the symphysis (A) and from the end of the symphysis a second line perpendicular to the fetal skull (B); the last line is the SHD.
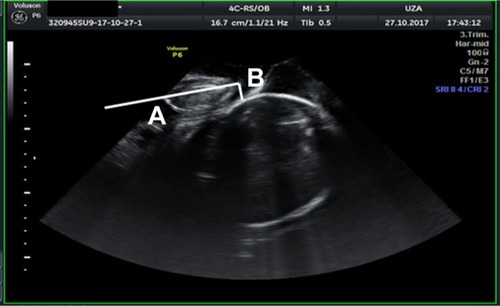
Figure 2 AOP is measured by drawing a line through the axis of the symphysis to the lowest point of the symphysis (A); next, from this point, a line is drawn at the anterior border of the skull (C); the angle between these two lines is measured (B) and it is the AOP.
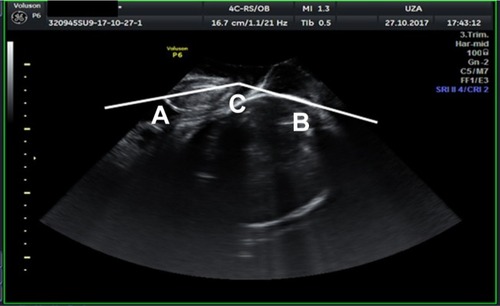
Table 1 Characteristics of study population
Figure 3 Bland–Altman plot for interobserver variability between two observers for SHD.
Abbreviation: SHD, symphysis–head distance.
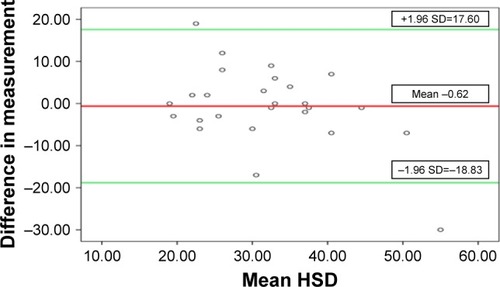
Figure 4 Bland–Altman plot for interobserver variability for AOP.
Abbreviation: AOP, angle of progression.
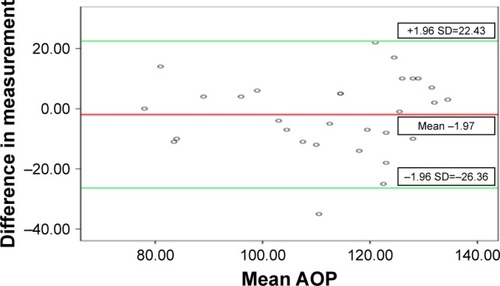
Table 2 ICC for interobserver variability
Table 3 ICC for intraobserver variability
Table 4 Answers by women in labor on statements concerning VE and translabial ultrasound
Table 5 Answers to statements on VE and translabial ultrasound by midwives