
Figures & data
Figure 1 Disposition of the study population.
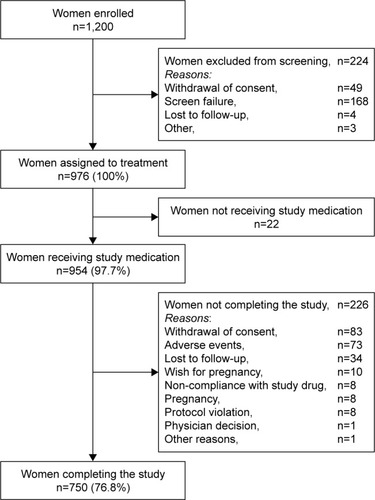
Table 1 Demographic and baseline characteristics of women included in the study
Figure 2 Kaplan–Meier plot of time to pregnancy during the 13 cycles of estradiol valerate/dienogest treatment in the full analysis set (n=954).
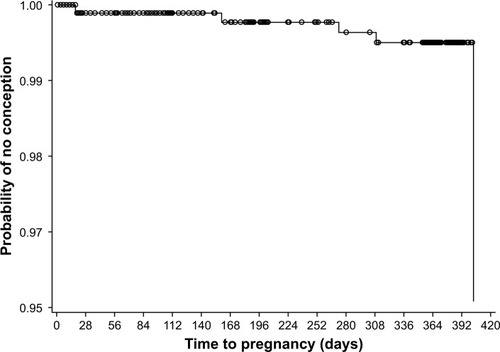
Table 2 Pearl Index and the exposure time during estradiol valerate/dienogest treatment in the full analysis set (n=954)
Table 3 Bleeding pattern parameters in the full analysis set (n=954)
Table 4 TEAEs occurring in ≥1% of women, study drug-related TEAEs occurring in ≥0.5% of women and TE-SAEs reported during the study by primary system organ class and preferred term in the safety analysis set (n=954)
Table 5 Serious adverse events and treatment-emergent SAEs reported during the study by primary system organ class and preferred term in the safety analysis set (n=954)
Table S1 Study drug-related TEAEs leading to treatment discontinuation in the safety analysis set (n=954)