
Figures & data
Figure 1 Consort diagram.
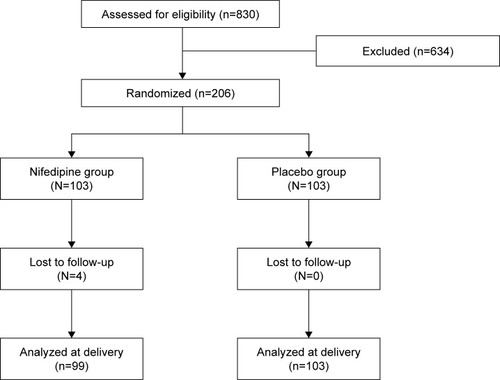
Table 1 Comparison of epidemiological characteristics
Table 2 Numbers of successful patients with regard to inhibition and delivery data in nifedipine and placebo groups
Figure 2 Flow diagram of the pregnancies with threatened preterm labor between nifedipine and placebo groups.
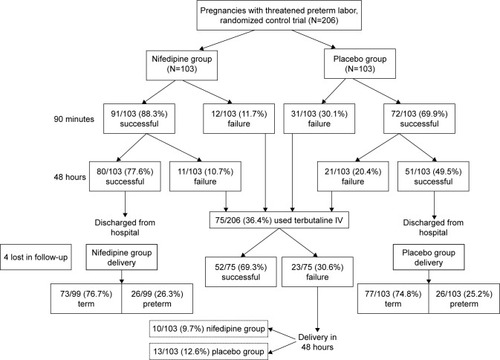
Table 3 Delivery and newborn data