Figures & data
Table 1 Sociodemographic characteristics of patients studied (N=201)
Table 2 Association between participants’ sociodemographic characteristics and presence of depression, anxiety and stress
Figure 1 Control group mean score differences between pre- and posttest.
Abbreviations: DASS-21, Depression, Anxiety and Stress Scale, 21 item version; GHS, global health status; QLQ-C30, European Organization for Research and Treatment of Cancer Quality of Life scale.
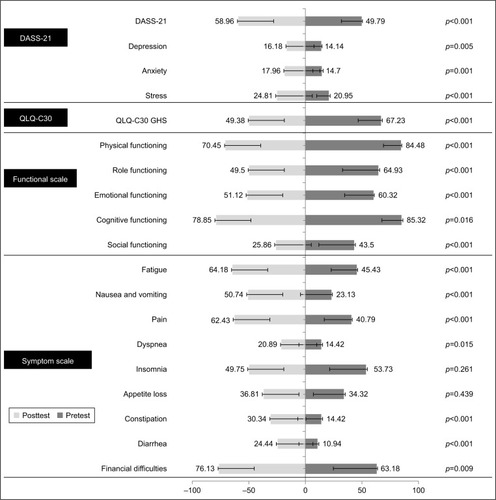
Figure 2 Crisis counseling group mean score differences between pre- and posttest.
Abbreviations: DASS-21, Depression, Anxiety and Stress Scale, 21 item version; GHS, global health status; QLQ-C30, European Organization for Research and Treatment of Cancer Quality of Life scale.
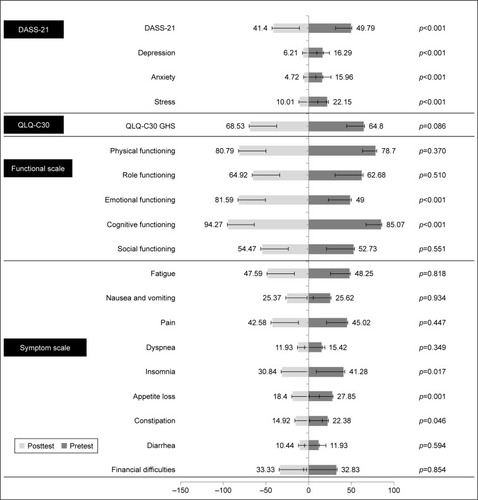
Figure 3 Psychoeducation group mean score differences between pre- and posttest.
Abbreviations: DASS-21, Depression, Anxiety and Stress Scale, 21 item version; GHS, global health status; QLQ-C30, European Organization for Research and Treatment of Cancer Quality of Life scale.
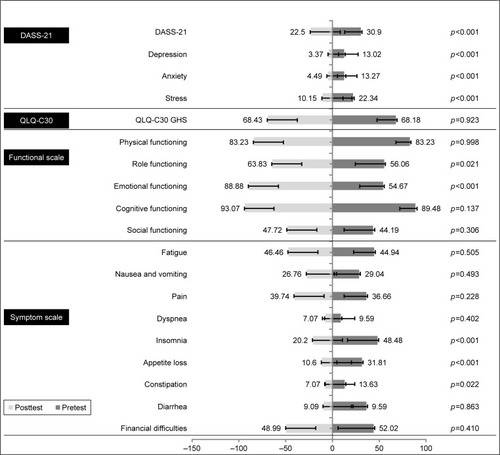
Figure 4 Post hoc analysis of the posttest scores of the three study groups.
Abbreviations: DASS-21, Depression, Anxiety and Stress Scale, 21 item version; GHS, global health status; QLQ-C30, European Organization for Research and Treatment of Cancer Quality of Life scale.
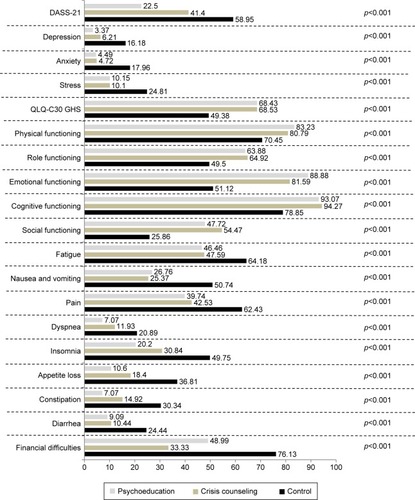
Figure 5 Follow-up results of DASS-21 and QLQ-C30 of the three study groups at 18 months.
Abbreviations: DASS-21, Depression, Anxiety and Stress Scale, 21 item version; GHS, global health status; QLQ-C30, European Organization for Research and Treatment of Cancer Quality of Life scale.
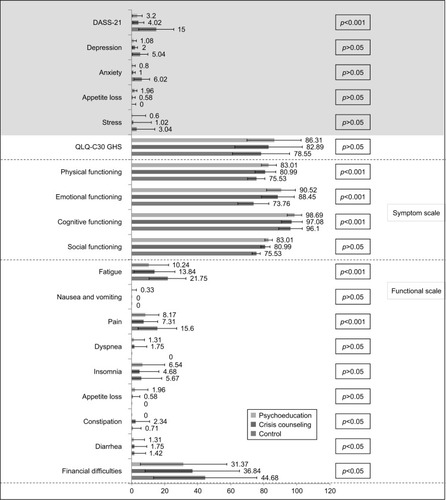
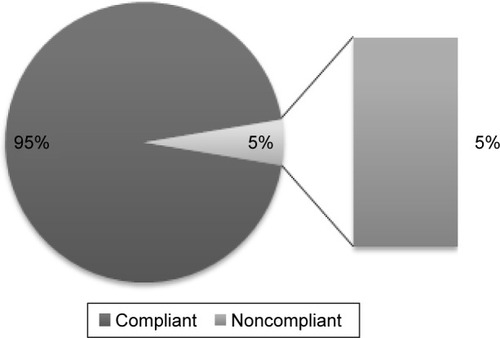
Figure 6 Treatment compliance of all patients over the study period.