
Figures & data
Table 1 Sociodemographic and clinical characteristics of the study groups, Oman, 2017
Table 2 Anthropometric characteristics of the study groups, Oman, 2017
Figure 1 GSH levels among controls vs PCOS cases.
Note: Results are expressed as mean±SEM.
Abbreviations: GSH, glutathione; PCOS, polycystic ovarian syndrome; SEM, standard error of mean.
Abbreviations: GSH, glutathione; PCOS, polycystic ovarian syndrome; SEM, standard error of mean.
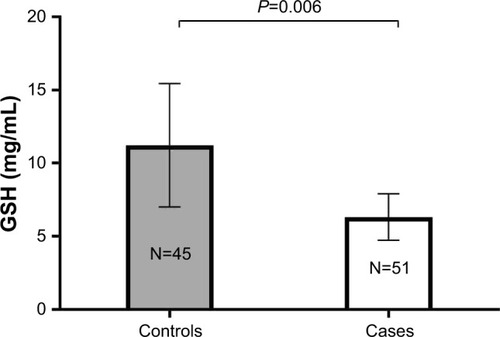
Figure 2 TAC levels among controls vs PCOS cases.
Notes: Results are expressed as mean±SEM. P>0.05.
Abbreviations: TAC, total antioxidant capacity; PCOS, polycystic ovarian syndrome; SEM, standard error of mean.
Abbreviations: TAC, total antioxidant capacity; PCOS, polycystic ovarian syndrome; SEM, standard error of mean.
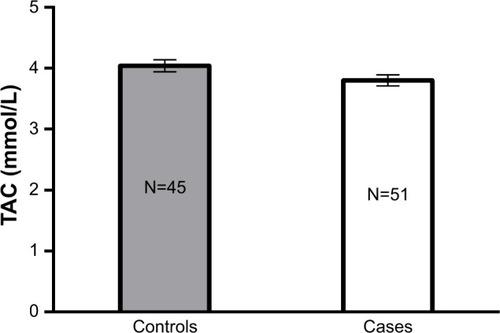
Table 3 Mean levels of sex hormones and oxidative stress biomarkers among the study groups, Oman, 2017
Table 4 Correlation between oxidative stress biomarkers and sex hormones, Oman, 2017
Table 5 Multilinear regression modeling of the association between TAC levels and each of the sex hormones and anthropometric parameters, Oman, 2017