Figures & data
Table 1 Primers of PLGF, sFLT1, VEGF and 18S genes
Table 2 VEGF family and demographic features
Table 3 VEGF family and conditions of the mother and newborns related to each group of study
Table 4 Umbilical cord anatomical abnormalities
Figure 1 VEGF-A. Representative immunohistochemistry staining for VEGF-A in the placental disc. Positive expression demonstrated for smooth muscle of chorionic vessels, 10× (A), stromal chorionic cells, 20× (orange arrows), with positive internal control in chorionic endothelium (white arrow), and villous endothelial positivity (B), 20× (orange arrow), with negative internal control in syncytiotrophoblast (blue arrow) (C). Amnion negativity is shown 20× (D).
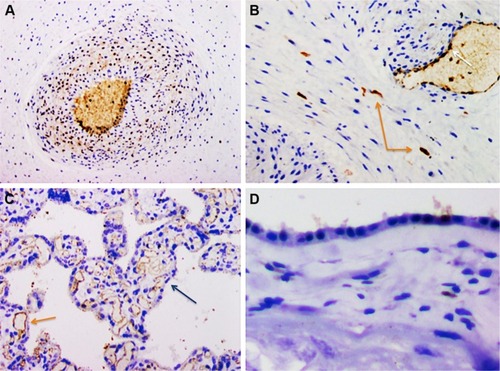
Figure 2 VEGF-A. Representative immunohistochemistry staining for VEGF-A in the umbilical cord.
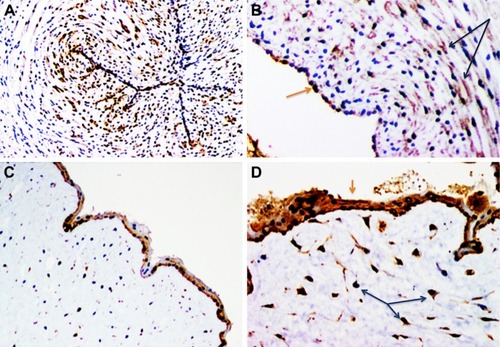
Figure 3 VEGF-R1. Representative immunohistochemistry staining for VEGF-R1 in the placental disc.
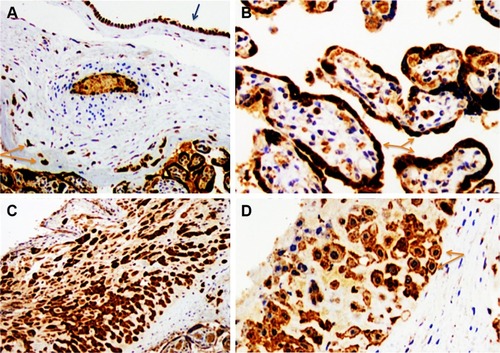
Figure 4 PLGF. Representative immunohistochemistry staining for PLGF.
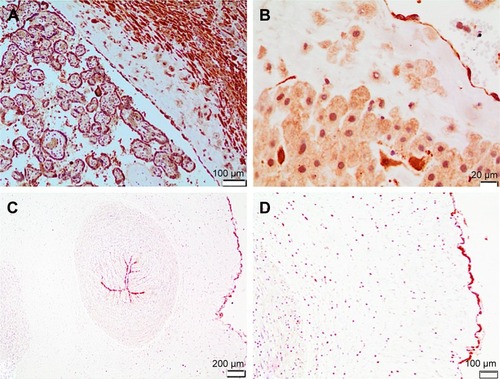
Figure 5 MMP1. Representative immunohistochemistry staining for MMP1 in the placental disc.
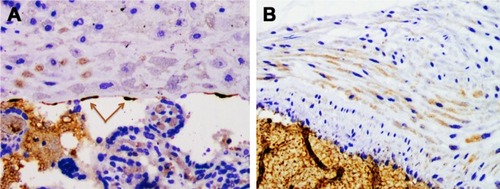
Figure 6 Immunohistochemistry summary.
Abbreviations: HDP, hypertensive disorders of pregnancy; UCAA, umbilical cord anatomical alterations.
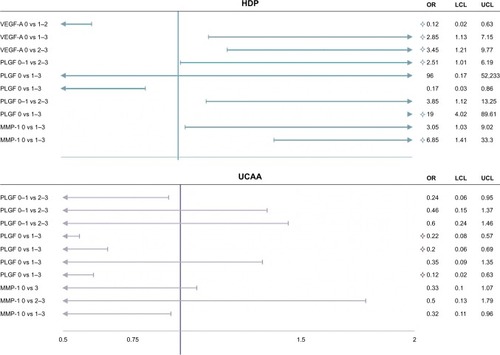
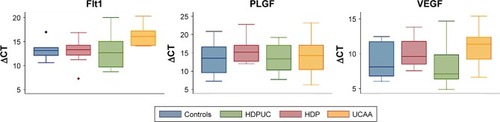
Figure 7 mRNA expression summary.
Abbreviations: CTRL, control; HDP, hypertensive disorders of pregnancy; HDPUC, HDP plus UCAA; UC, umbilical cord; UCAA, UC anatomical abnormalities.
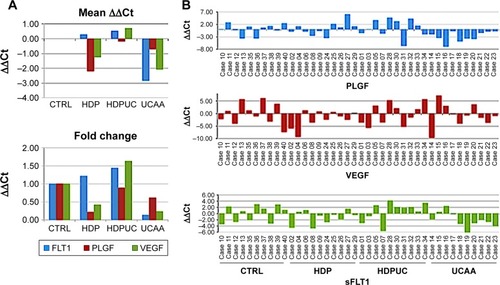
Figure 8 mRNA expression summary.
Abbreviations: HDP, hypertensive disorders of pregnancy; HDPUC, HDP plus UCAA; UC, umbilical cord; UCAA, umbilical cord anatomical abnormalities.