Figures & data
Table 1 Demographic data, Chlamydia PCR DNA expression, and statistical analysis of the studied cases
Figure 1 ROC curve analysis to calculate the best cutoff value to differentiate tubal carcinoma group vs ovarian carcinoma and control groups.
Notes: Area under the curve =0.8, P=0.01 at a cutoff value of 15.1 with sensitivity =80%, specificity =93.7%, and accuracy =88.46%; positive predictive value =77.42; negative predictive value =94.7%. The arrow points to the best cutoff value.
Abbreviation: ROC, receiver operating characteristic.
Abbreviation: ROC, receiver operating characteristic.
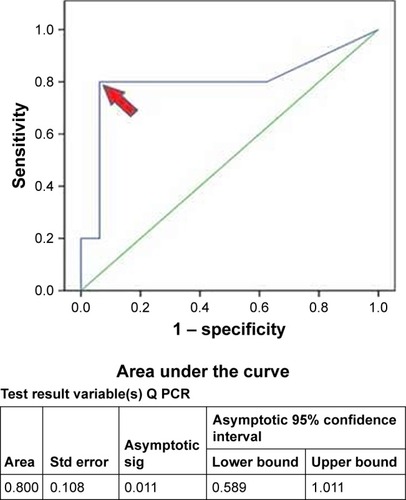
Table 2 Comparison between the three groups regarding PCR quantitative values
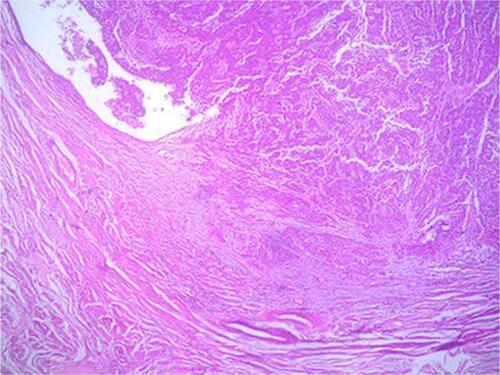
Figure S1 High-grade serous tubal carcinoma is seen distending the tubal lumen (H&E ×10).
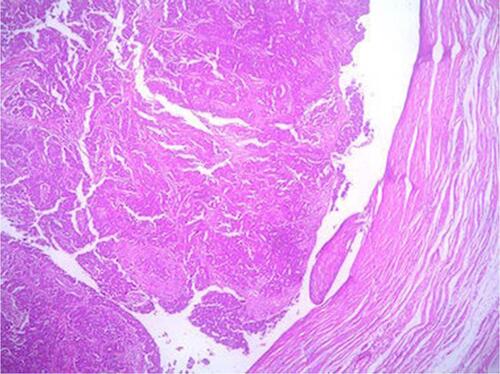
Figure S2 High-grade serous tubal carcinoma arises from tubal mucosa and infiltrates the submucosa (H&E ×10).