Figures & data
Figure 1 Association between the intensity of peak m/z = 4459 and odds ratio for CIN 2+a.
Abbreviation: CIN, cervical intraepithelial neoplasia.
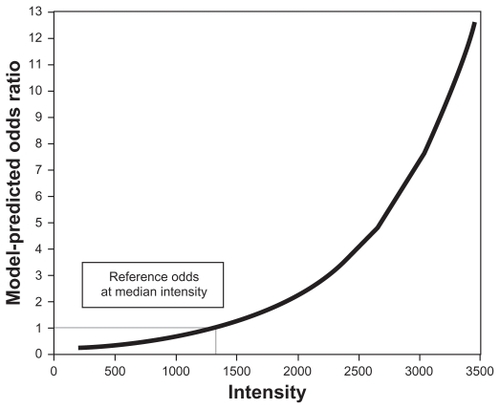
Figure 2 Association between the intensity of peak m/z = 4154 and odds ratio for CIN 2+ for Caucasian Americansa and African Americans.b
Abbreviation: CIN, cervical intraepithelial neoplasia.
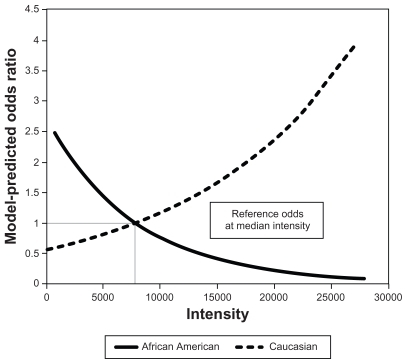
Figure 3 Receiver operating characteristic curve for all cases (CIN 2+) and all controls (≤CIN 1).
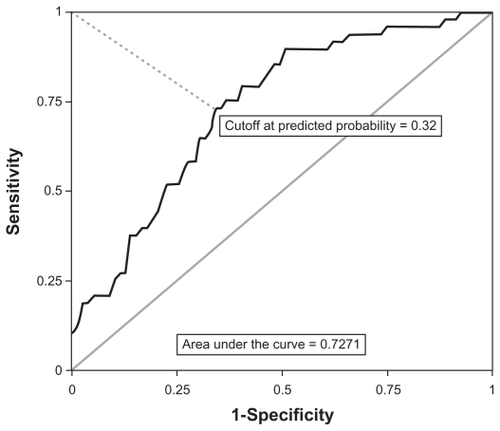
Table 1 Cross-validated screening test measures for the final multivariate model and individual models with the two components of the final model predicting cervical intraepithelial neoplasia (CIN) 2+ vs ≤CIN 1 (n = 127)
Figure 4 Receiver operating characteristic curve for CIN 3 and controls diagnosed with <CIN 1.
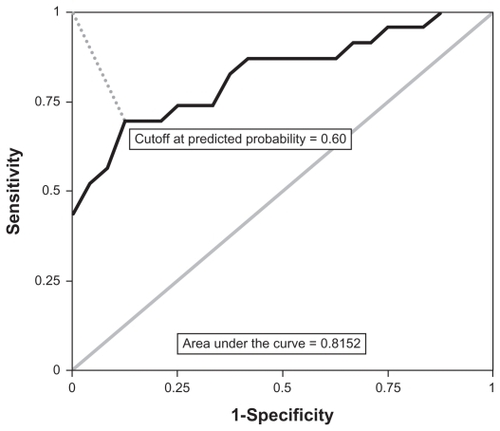
Table 2 Cross-validated screening test measures for the final multivariate model and individual models with the two components of the final model predicting cervical intraepithelial neoplasia (CIN) 3 vs <CIN 1 (n = 47)
Table 3 Cross-validated screening test measures by race for a model predicting cervical intraepithelial neoplasia (CIN) 2+ vs ≤CIN 1, using peak [m/z = 4459] as the only predictorTable Footnotea
Table 4 Cross-validated screening test measures by race for a model predicting cervical intraepithelial neoplasia (CIN) 2+ vs ≤CIN1, using peak [m/z = 4154] as the only predictor
Table 5 Cross-validated screening test measures by race for a model predicting cervical intraepithelial neoplasia (CIN) 3 vs <CIN 1, using peak [m/z = 4459] as the only predictor (n = 47)Table Footnotea