Figures & data
Table 1 Baseline characteristics (with percentages rounded for clarity)
Figure 1 Flow diagram of the trial.
Abbreviations: LNG-IUS, levonorgestrel intrauterine system; TCRE, trans-cervical resection of the endometrium.
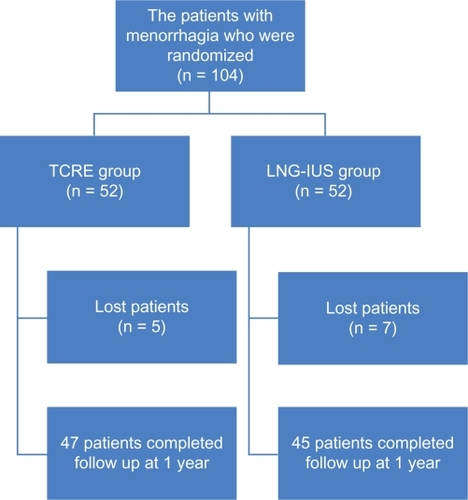
Table 2 The satisfaction and acceptability, menstrual status and symptoms at the 12th month post-procedure follow up