
Figures & data
Box 1 Recommendations based on study findings
Figure 1 Distribution of expenditure by total expenditure and all expenditure sub-categories (N=2280).
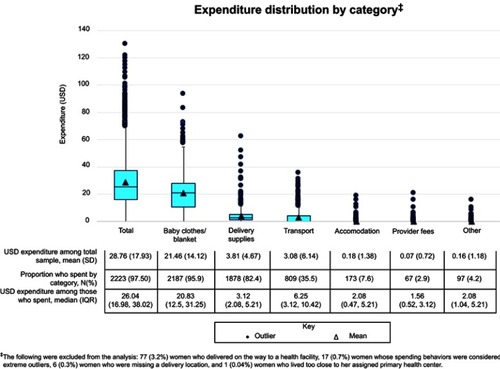
Figure 2 Distribution of expenditure by delivery location for total expenditure and top three sub-categories.
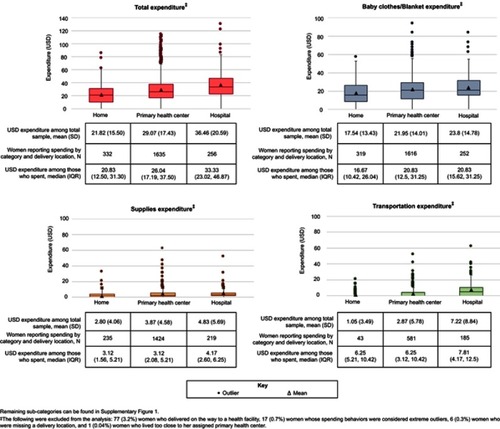
Table 1 Characteristics of recently delivered women living ≥10km from their assigned primary health center for the total sample and only those who spent money on delivery‡
Table 2 Primary transport method used and amount of expenditure on transport among women with a facility-based delivery‡
Table 3 Predictors of any expenditure (Total Expenditure>0) for delivery and a linear regression of the natural log of total expenditure by women living ≥10 km from their assigned primary health center who also spent money on their delivery‡
Table 4 Two-part model of expenditures for recently delivered women living ≥10 km from their assigned primary health center‡,a
Data availability
The authors will provide the de-identified household survey and in-depth interview demographic data upon reasonable request to the Principle Investigator, Dr. Nancy A Scott, at [email protected]. The in-depth interview transcripts are not publicly available due to ethical restrictions on publicly sharing data which are of sensitive nature and contain potentially identifiable information instituted by the Boston University IRB and the ERES Converge IRB in Zambia. Qualitative data requests may be sent to the Boston University IRB at [email protected].