Figures & data
Figure 1 CONSORT flowchart for the study.
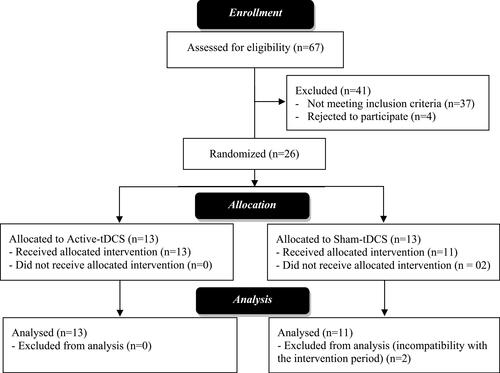
Figure 2 Research protocol.
Notes: ƚOutcome evaluated on first, second, and third days of menstruation. *All outcomes evaluated only on the first day of menstruation.
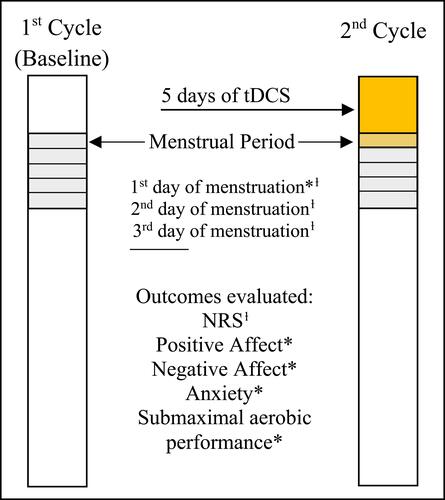
Table 1 Sociodemographic and Clinical Variables
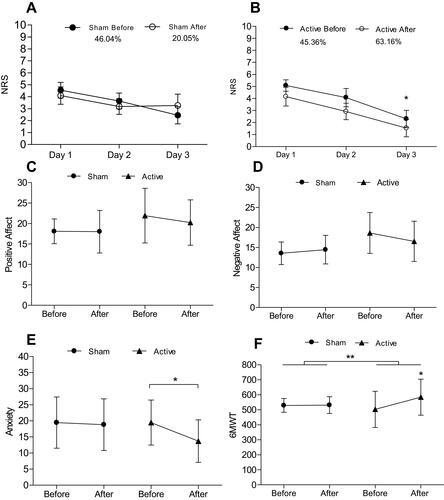
Figure 3 (A, B) Mean changes in numeric rating scale (NRS) assessed for 3 consecutive days before treatment (baseline) and after intervention. *Significant difference in active tDCS when comparing day 1 to day 3. Percentages describes the difference between day 1 and day 3 in each group. (C, D) No significant changes in positive and negative affect were found. (E) Anxiety showed a significant difference between day 1 and day 3 in active tDCS. (F) Six-Minute Walk Test (6MWT) indicates statistically significant differences between groups of intervention** and in intragroup analysis for active tDCS*.