Figures & data
Figure 1 Flow diagram of the randomized controlled trial of membrane sweeping frequency.
Abbreviation: n, number.
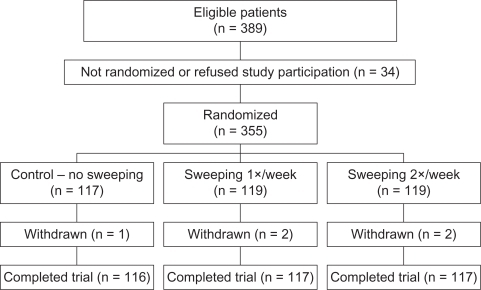
Table 1 Population demographics at baseline. Unless otherwise stated n (%) are shown
Table 2 Obstetric outcomes for three randomization groups. Unless otherwise stated n (%) are shown
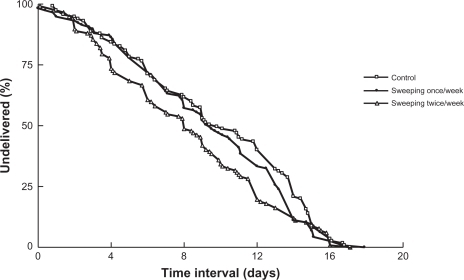
Figure 2 Kaplan–Meier survival curves comparing the time interval between randomization and delivery. Overall and pair-wise log-rank tests were performed to assess the equality of survivor functions.
Note: The results of the survival curve indicate that there were no significant differences between the three groups (P = 0.081).