
Figures & data
Table 1 Demographic and Anthropometric Characteristics of Breast Cancer Patients (N=223)
Table 2 Description of Glycemic Status and HbA1c% Levels Among Breast Cancer Patients (N=223)
Table 3 Clinicopathologic Characteristics of Breast Cancer Patients (N=189)
Table 4 Correlation Analysis of HbA1c Levels with Selected Anthropometric and Clinicopathologic Characteristics of Breast Cancer Patients (N=223) (Continuous Variables)
Figure 1 HbA1c levels in relation to anthropometric measurements and menopausal status of breast cancer patients. Average blood levels of HbA1c were compared according to (A) age, (B) waist circumference, (C) waist-hip ratio, (D) BMI, and (E) menopausal status of breast cancer patients. *Statistically significant at p<0.05.
Abbreviations: BMI, body mass index; HbA1c, glycosylated hemoglobin A1c.
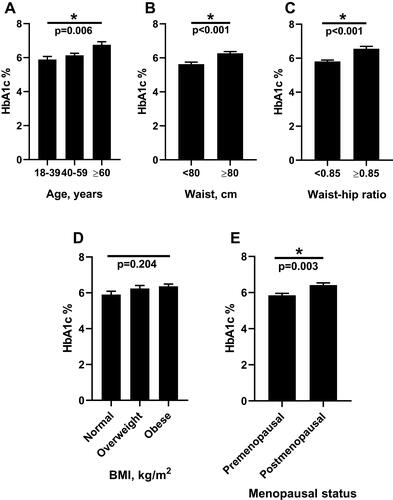
Table 5 Association Between HbA1c with Clinicopathologic Characteristics in Breast Cancer Patients Based on Menopausal Status (N=189)