
Figures & data
Table 1 Clinical Characteristics of the Post-UAE and Control Groups
Table 2 Detailed Patient Information of the Post-UAE Group
Table 3 Clinical Outcomes of Subsequent Pregnancies
Table 4 Comparison of the Rate of Placenta Accreta in Various Patterns of Patient Baseline Characteristics
Figure 1 Forest plot of odds ratio of placenta accreta spectrum in post-UAE cases. Forest plots show the OR and 95% CI of the risk for PAS. Various combinations were determined, and we revealed that post-UAE is a significant risk factor for PAS except for the P-UAE with PP and p-CD groups. (-) indicates that the patients with pointed factor were excluded. Bold indicates statistical significance.
Abbreviations: CD, cesarean delivery, CI, confidence interval; IVF, in vitro fertilization-embryo transfer pregnancy; PAS, placenta accreta spectrum, p-CD; previous cesarean delivery; PP, placenta previa; p-UAE, post-UAE; UAE, uterine artery embolization.
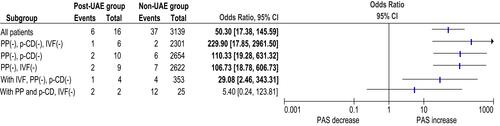
Table 5 Literature Review on the Rate of Placenta Accreta Spectrum in Subsequent Pregnancies Following Uterine Artery Embolization Due to Postpartum Hemorrhage