Figures & data
Figure 1 Installation of the ACUSON S2000™ ABVS ultrasound system. On the left-hand side is the ACUSON S2000™ machine, on the right-hand side is the 14L5BV volume transducer attached to a mechanical arm.
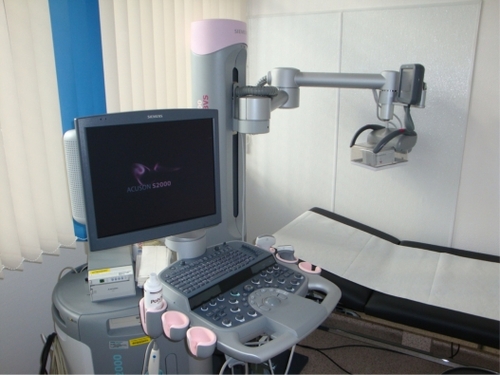
Figure 2 Multi-planar reconstruction of the volume data displayed on the automated breast volume scanner workplace.
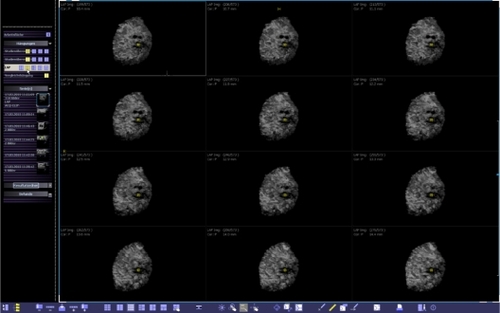
Figure 3 Coronal view of the volume data at a depth of 10.4 mm from the skin line. The yellow spot indicates the position of the nipple.
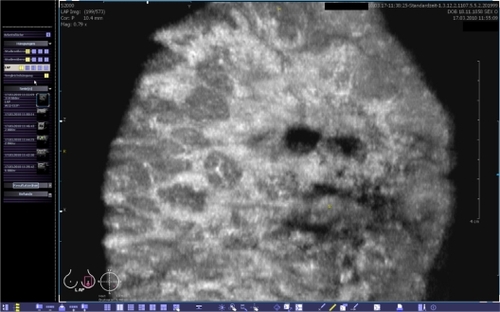
Figure 4 This view provides the coronal (left), transverse (upper right) and sagittal (lower right) planes. The body marker indicates that this volume was acquired at the apex of the left breast. The yellow spot marks the position of the nipple. A point of interest can be chosen and marked by two orthogonal lines. Then, the corresponding cross-sections are calculated in real-time and shown in the other planes. The images can be optimized by adjusting the magnification, brightness, and contrast.
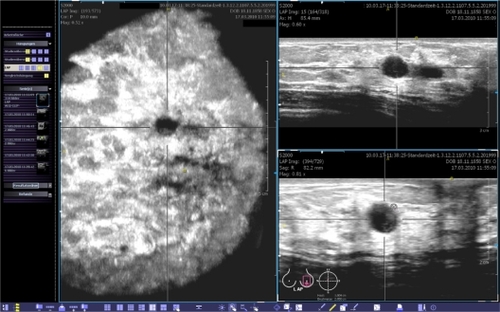
Figure 5 Predefined positions of the scanner, which are used to cover the entire volume of an individual breast.
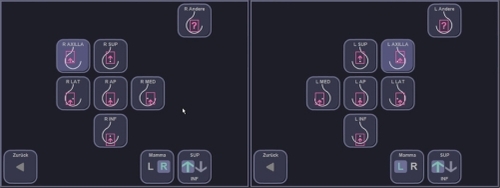
Table 1 Agreement between examiner 1 (gold standard) and examiner 2 (experimental ABVS data interpretation) focusing on the correct clinical decision of whether the patient should undergo a control ultrasound due to a suspicious finding or whether the patient should be defined as healthy as there is no suspicious lesion
Table 2 Agreement between examiner 1 (gold standard) and examiner 2 (experimental ABVS data interpretation) focusing on the correct classification according to the ACR BI-RADS®-US system
Figure 6 Case from the database demonstrating a BI-RADS®-US 1 breast that was interpreted as a BI-RADS®-US 2 lesion, mainly visible in the coronal plane by examiner 2.
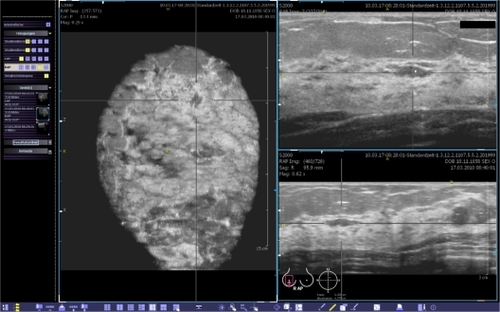
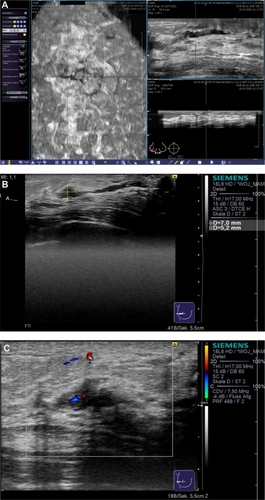
Figure 7 Case from the database demonstrating a BI-RADS®-US 5 lesion that remained occult in the mammogram. The lesion was easily detected in the volume data set by examiner 2 (A) and a second-look ultrasound (B) with histological confirmation was correctly requested.
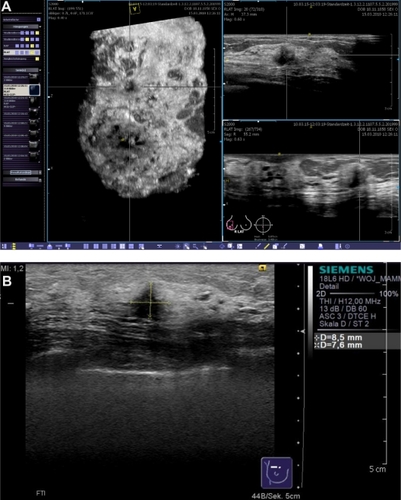
Figure 8 Clinical example of multifocal breast cancer. With conventional ultrasound, even when using techniques such as SieScape® panoramic imaging, it is difficult to display more than three lesions at the same time (A). In the coronal plane, derived from the volume data sets, all foci can be viewed at the same time (B). While remaining aware of the extension of tissue changes, we planned a quadrantectomy after wire localization.
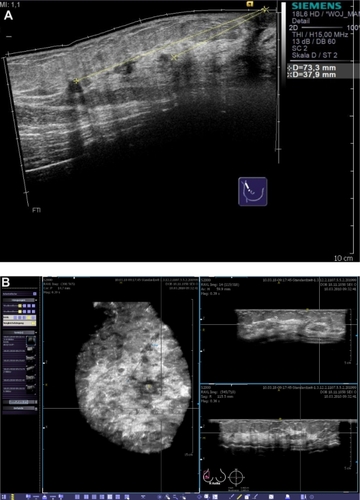
Figure 9 Clinical example of an invasive lobular breast cancer. In order to estimate the extension of the lesion, we performed both MRI and the automated breast volume scanner. The coronal planes of both imaging modalities demonstrated a correlation in the measurements of the lesion.
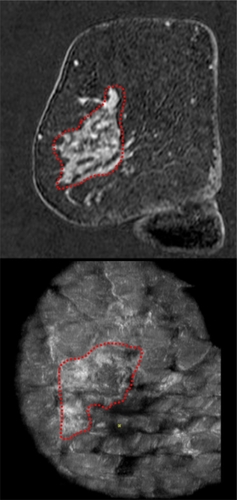
Figure 10 Clinical example of a patient with nipple discharge. The duct ectasia can be seen in the reconstructed coronal plane (A, left), and an intraductal lesion was suspected in the transverse (A, upper right) and sagittal planes (A, lower right). Conventional ultrasound (B) confirmed the diagnostic findings of a vasculated (C) papillary lesion.