Figures & data
Table 1 Baseline Dysmenorrhea Score (Sum of Two Sub-Scores)
Table 2 Evaluation Criteria for Menstrual Pain and the Coloration Used for the Heatmap
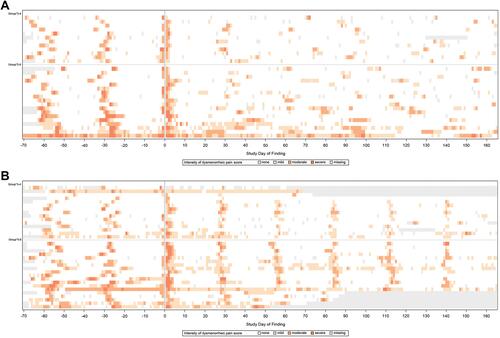
Figure 1 Overall menstrual pain scores over 24 weeks in the full analysis set following treatment with the flexible extended regimen (A) and the 28-day cyclic regimen (B), as shown with heatmapping. The reference line at Day 0 indicates the first day of study drug administration. Lower baseline dysmenorrhea scores (3–4) are shown in the top half of the heatmap, and higher baseline dysmenorrhea scores (5–6) in the bottom half.
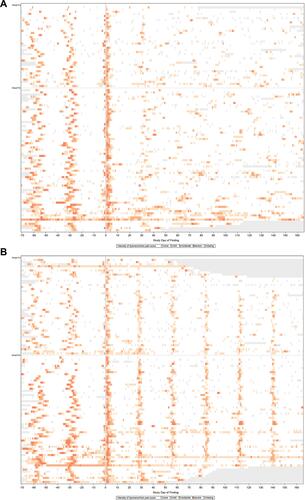
Table 3 Number of Patients with Menstrual Pain by Intensity
Table 4 Rate Ratios for Severe Menstrual Pain for the 28-Day Cyclic Regimen vs Flexible Extended Regimen According to Baseline Dysmenorrhea Score
Figure 2 Mean cumulative function of the flexible extended regimen and the 28-day cyclic regimen.
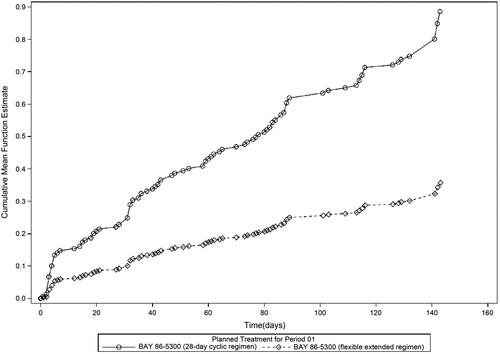
Figure 3 Menstrual pain scores as shown by heatmapping after treatment with the flexible extended regimen (A) or the 28-day cyclic regimen (B) in the group with primary dysmenorrhea. Lower baseline dysmenorrhea scores (3–4) are shown in the top half of the heatmap, and higher baseline dysmenorrhea scores (5–6) in the bottom half.
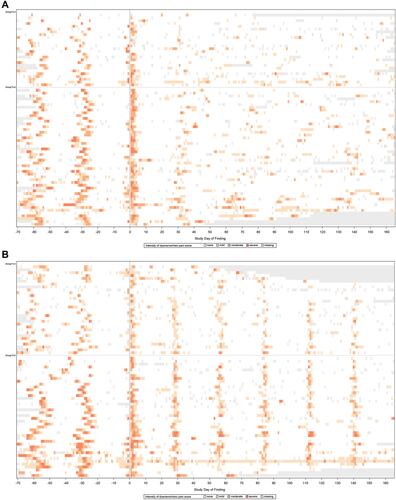
Figure 4 Menstrual pain scores as shown by heatmapping after treatment with the flexible extended regimen (A) or the 28-day cyclic regimen (B) in the group with secondary dysmenorrhea. Lower baseline dysmenorrhea scores (3–4) are shown in the top half of the heatmap, and higher baseline dysmenorrhea scores (5–6) in the bottom half.