
Figures & data
Table 1 Demographic and Clinical Characteristics of the Study Population for Matched Cohort of Symptomatic Women vs Women in the Reference Group at Index Date (Date of First Menopause Symptom). (N=34,092). All N (%) Unless Otherwise Stated
Table 2 Healthcare Utilization in the 1- Year Baseline Period (N=34,092)
Figure 1 One-year post-index prevalence of comorbid conditions for symptomatic women (cases) versus women in the reference group (controls), by age, N=34,092. *Significant difference between menopause and control cohorts.
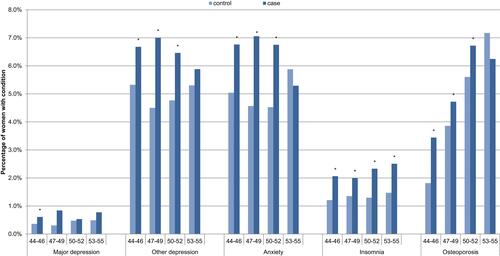
Figure 2 One-year post-index prevalence of medication for symptomatic women (cases) versus women in the reference group (controls), by age N=34,092. *Significant difference between menopause and control cohorts.
Abbreviations: SSRI, selective serotonin reuptake inhibitors; SNRI, serotonin-norepinephrine reuptake inhibitor.
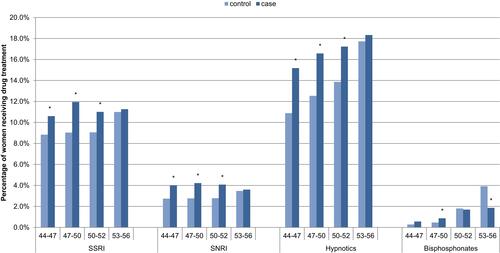
Table 3 Adjusted Odds Ratios Associated with Categorical Healthcare Utilization and Hysterectomy Procedures (Yes/No) in the Index Year (Using Conditional Logistic Regression)
Figure 3 One-year post-index prevalence of healthcare utilization for symptomatic women (cases) versus women in the reference group (controls), N=34,092. *Significant difference between menopause and control cohorts.
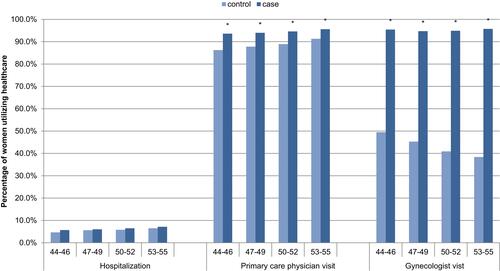
Table 4 Adjusted Odds Ratios Associated with the Frequency of Hospitalizations, Primary Care Physician Visits and Gynecologist Visits Using for Index Year (Using Generalized Linear Regression Modeling)