Figures & data
Figure 1 Measurement of ultrasound shear wave speed. Left circle, the region of interest (ROI) of the upper point, right circle, ROI of the lower point. The diameter of the target regions of interest was set to 5 mm.
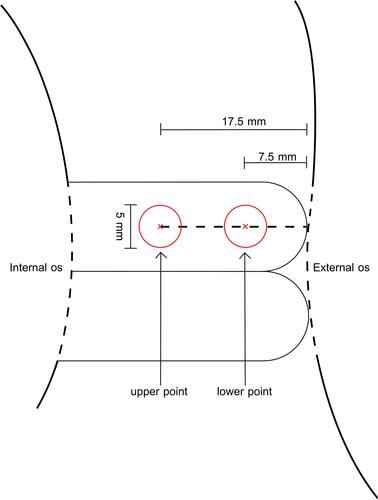
Figure 2 Schematic diagram of a twin view for measurement sites. A(left): elastographic map, B(right): grey-scale B mode that the measurement was done at the anterior lip of cervix 7.5 mm (lower point) and 17.5 mm (upper point) from the external cervical os.
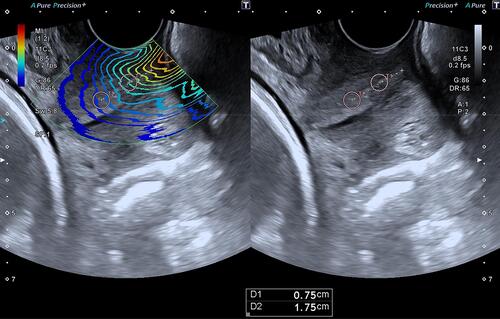
Figure 3 Participant eligibility diagram.
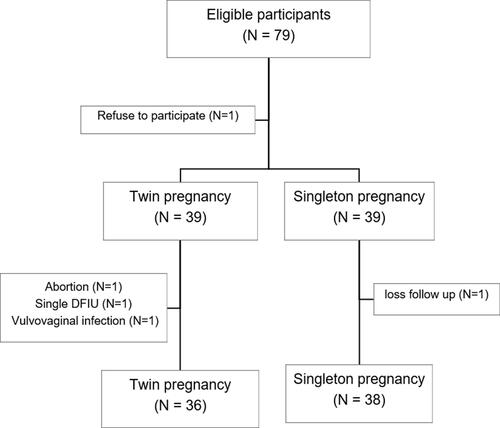
Table 1 Baseline Characteristics
Table 2 Cervical Shear Wave Speed (SWS, m/s) by Transvaginal Ultrasound Elastography
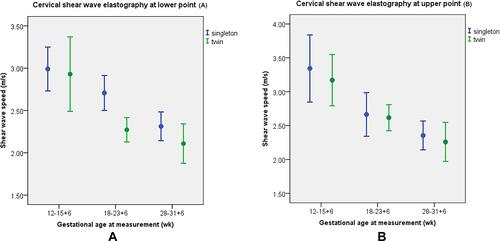
Figure 4 Regression line of the mean SWS and 95% confidence interval of the lower point (A) and upper point (B).