Figures & data
Table 1 Sociodemographic characteristics of 1316 women who had intrauterine devices inserted between 2006 and 2009
Figure 1 IUD discontinuation rates at 12, 24, and 36 months in all three provinces.
Abbreviation: IUD, intrauterine device.
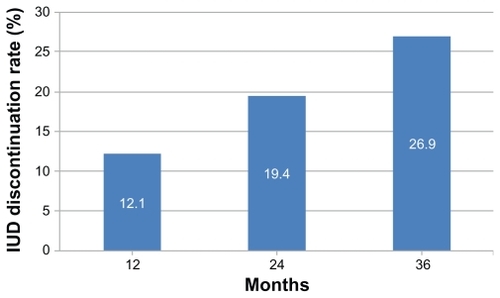
Table 2 Unadjusted and adjusted hazard ratios of intrauterine device discontinuation at 36 months, by sociodemographic and reproductive characteristics