Figures & data
Figure 1 2D SHG image in a sagittal section of the uterus showing the triangular cesarean scar niche.
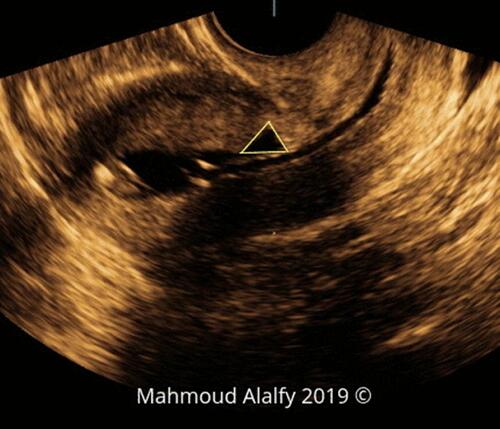
Figure 2 2D SHG image in a sagittal section of the uterus showing the triangular cesarean scar niche.
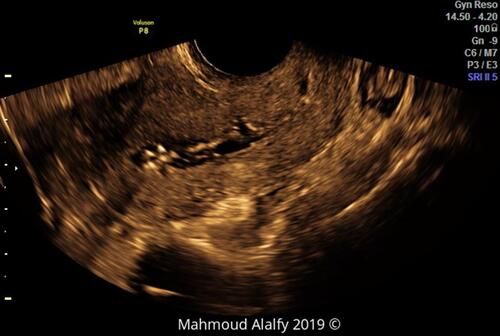
Table 1 Demographic Data of the Women Included in the Study
Table 2 Degree of Agreement Between 2D SHG and 3D SHG in Detection of Niche BW
Table 3 Degree of Agreement Between 2DSHG and 3D SHG in Detection of Niche Depth
Table 4 Degree of Agreement Between 2D SHG and 3D SHG in Detection of RMT
Figure 3 2DSHG image in a sagittal section of the uterus showing the cesarean scar niche depth.
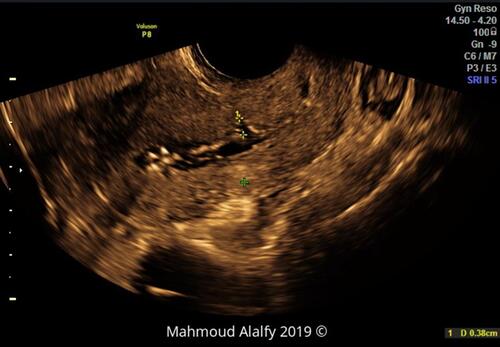
Table 5 Degree of Agreement Between 2D SHG and 3D SHG in Measurement of Niche Width
Figure 4 2D SHG image in a sagittal section of the uterus showing the cesarean scar niche BW.
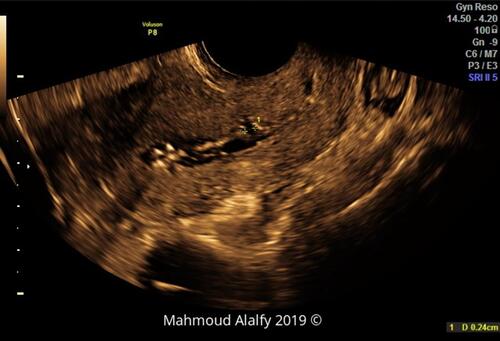
Figure 5 (Aand B) demonstrate 3D SHG rendering image of the uterus showing the cesarean scar niche width in the coronal cut of the 3D volume, Figure 5 C shows 3D SHG with HD live rendering demonstrating the niche width .
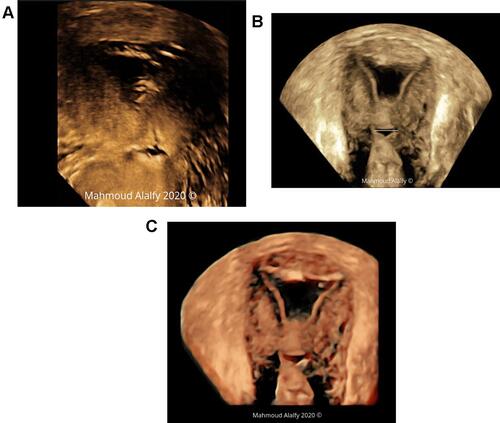
Figure 6 3D SHG image of the uterus showing the cesarean scar niche depth.
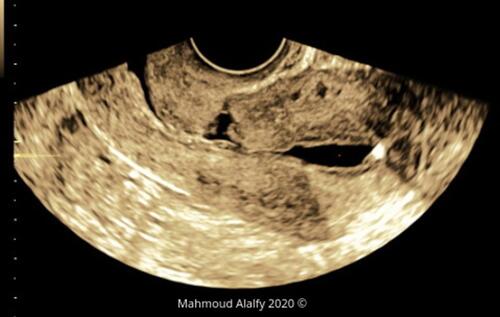
Figure 7 3D SHG image of the uterus showing the cesarean scar niche BW.

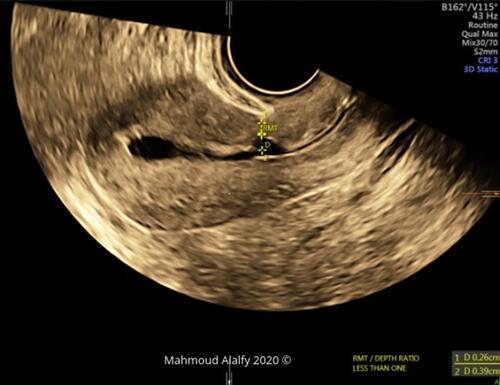
Figure 8 2D SHG image of a sagittal section of the uterus showing the RMT.

Figure 9 3D SHG image in the sagittal cut that demonstrates the RMT with adhesions in front of the niche.
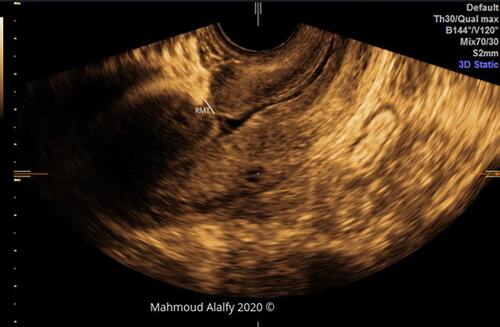
Figure 10 2D SHG image showing a sagittal section in 3rd degree RVF uterus with a markedly defective cesarean scar niche.
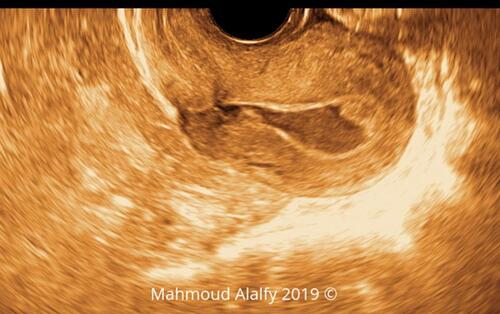
Figure 11 3D SHG image in the sagittal cut that demonstrates RMT/Depth ratio (less than 1) with a thin RMT with adhesions in front of the niche.