Figures & data
Figure 1 Diabetic mastopathy: ultrasound of a palpable abnormality shows an ill-defined mass-like area with decreased echogenicity and concerning features.
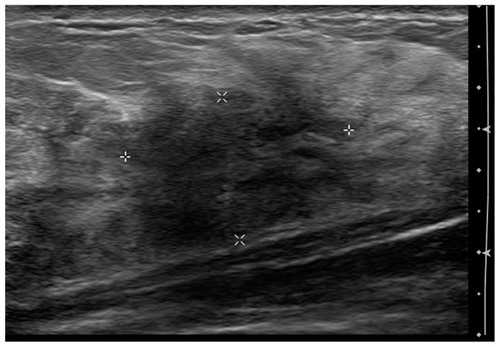
Figure 2 Breast biopsy showing lymphocytic mastitis consistent with diabetic mastopathy. Hematoxylin-eosin stains: Left, original magnification 400×; right top, original magnification 400×; right bottom, original magnification 400×.
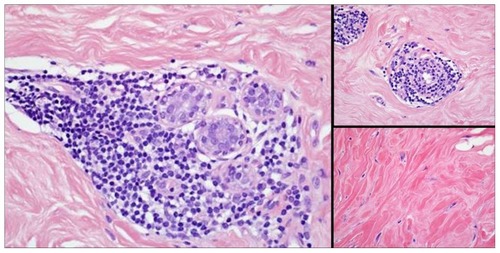
Figure 3 Bilateral mammogram showing benign arterial calcifications. (A) Right mediolateral oblique view shows arterial calcification (arrows) and (at top right of image) a pacemaker. (B) Left mediolateral oblique view shows arterial calcification (arrows).
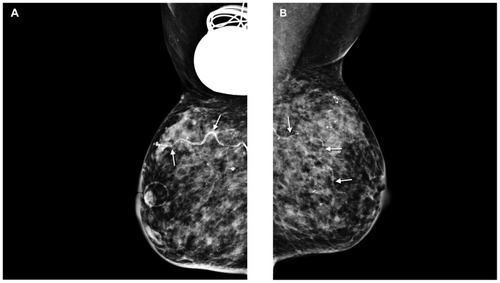
Figure 4 Plasmacytoma of the breast. Left mammogram shows (A) a small well defined mass (circle) in the left craniocaudal view and (B) an abnormal lymph node (arrows) in the mediolateral oblique view. (C) Ultrasound shows a hypoechoic mass (arrows) with hyperechoic rim.
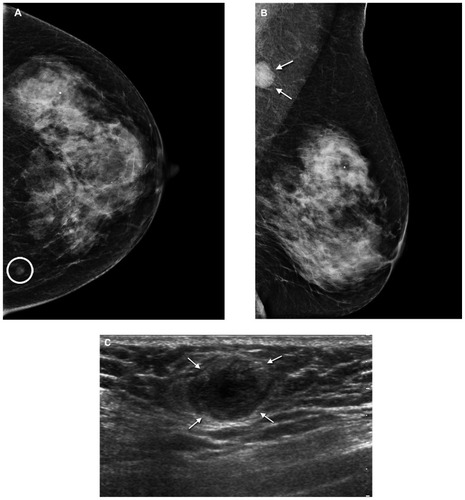
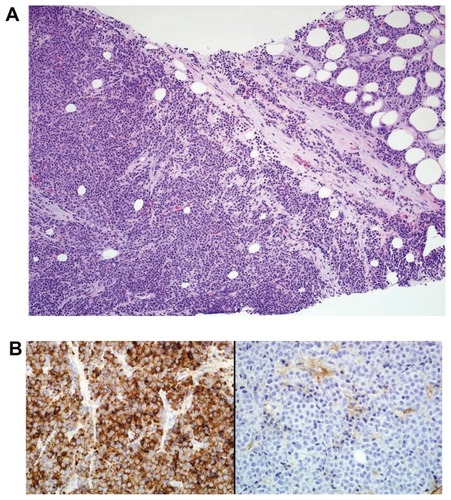
Figure 5 Breast biopsy. (A) Breast biopsy shows plasma cell neoplasm (hematoxylineosin stain, original magnification 200×). (B) Left, κ immunoglobulin antibody light chain stain is positive (original magnification 400×) and, right, λ immunoglobulin antibody light chain stain is negative (original magnification 400×).