
Figures & data
Table 1 Socio-Demographic Characteristics of the Study Participants
Table 2 Association of Variables Under Bivariate Logistic Regression Analysis, N = 240
Figure 1 Serology test status of the pregnant women, N = 240.
Abbreviation: HBsAG, Hepatitis B surface antigen.
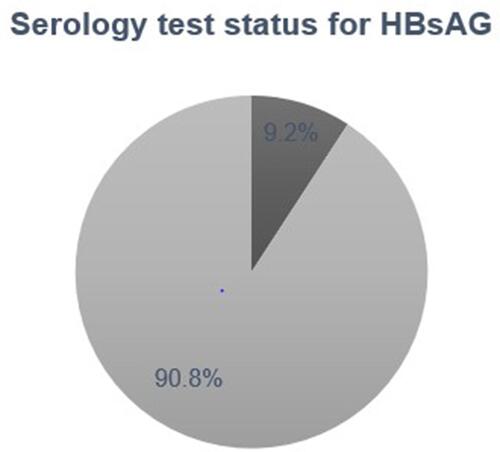
Table 3 Association of Variables Under Multivariate Logistic Regression Analysis, N = 240