
Figures & data
Table 1 Comparison of Age, Duration of Married Life and Period of Gestation Between Group 1 and Group 2
Table 2 Comparison of Parity Between Group 1 and Group 2
Figure 1 CONSORT flow diagram.
Note: https://journals.plos.org/plosmedicine/article id=10.1371/journal.pmed.1000251Citation: Schulz KF, Altman DG, Moher D, for the CONSORT Group (2010) CONSORT 2010 Statement: Updated Guidelines for Reporting Parallel Group Randomised Trials. PLoS Med 7(3): e1000251.Copyright: © 2010 Schulz et al. Creative Commons Attribution License.Citation19
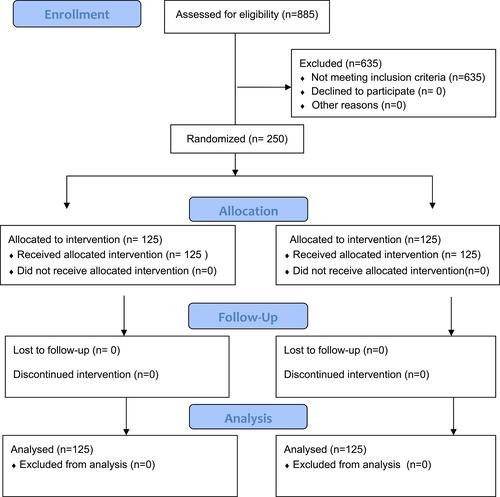
Table 3 Comparison of Pre-Operative (Pre-Op) and Post Operative (Post-Op) Hemoglobin in gm/dl and Difference in the Hemoglobin Levels in Group 1 and Group 2
Table 4 Comparison of Heart Rate, Systolic Blood Pressure, Diastolic Blood Pressure and SPO2 Between Group 1 and Group 2
Table 5 Comparison of ECG Changes, Adverse Effects and Use of Additional Uterotonics Between Group 1 and Group 2
Table 6 Comparison of the Uterine Tone Following the Extraction of the Baby Between Group 1 and Group 2