
Figures & data
Table 1 Sociodemographic Characteristics of Respondents in Ezha District, Southern Ethiopia, March 1–30, 2020
Table 2 Obstetric Characteristics of Respondents in Ezha District, Southern Ethiopia, March 1–30, 2020
Figure 1 Danger signs reported by respondents during their last pregnancy in Ezha district, Southern Ethiopia, March 1–30, 2020 (n=149).
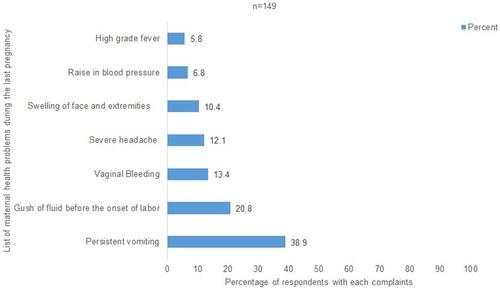
Figure 2 Reasons for non-compliance with the prescribed PNC visit schedules among respondents in Ezha District, Southern Ethiopia, March 1–30, 2020 (n=447).
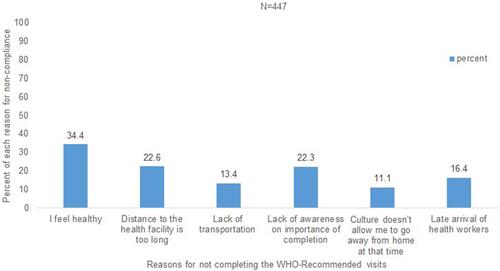
Table 3 Determinants of Frequency of Postnatal Care of Women in Ezha District, Southern Ethiopia, March 1–30, 2020
Figure 3 Percentages of respondents getting each WHO-recommended contents of care during PNC visit in Ezha district, Southern Ethiopia, March 1–30, 2020 (n=556).
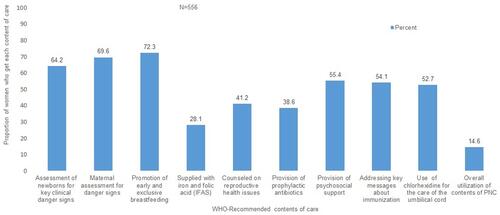
Table 4 Results of the Multivariable Generalized Linear Regression Analysis with Poisson Log Link to Identify the Determinants of Utilization of Contents of PNC Visits Among Respondents in, Ezha District, Southern Ethiopia, March 1–30, 2020