
Figures & data
Table 1 Demographic Data of the Study Participants
Figure 1 Flow chart of the study participants.
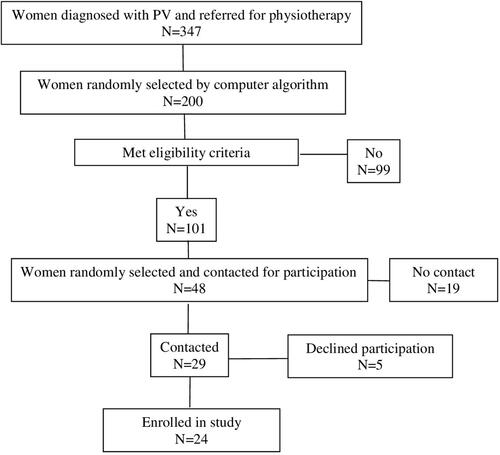
Figure 2 Patients’ level of pain during sexual intercourse at the time of the survey vs during the recovery period.
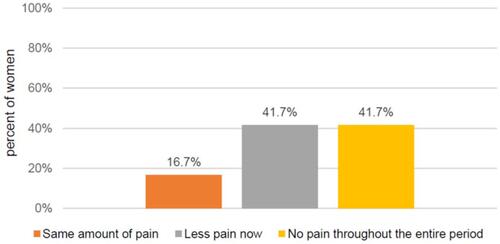
Figure 3 Level of pain at time of survey.
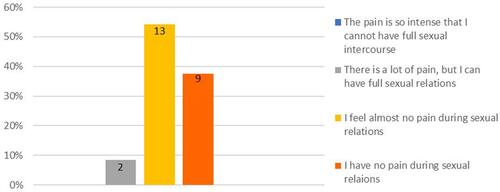
Figure 4 Rating of pain levels during various activities before and after treatment.
Notes: **p<0.01, ***p<0.001.
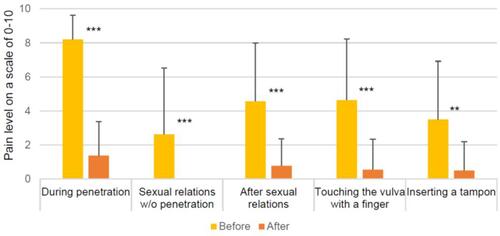
Figure 5 Satisfaction with treatment: level of pain relief following physical therapy.
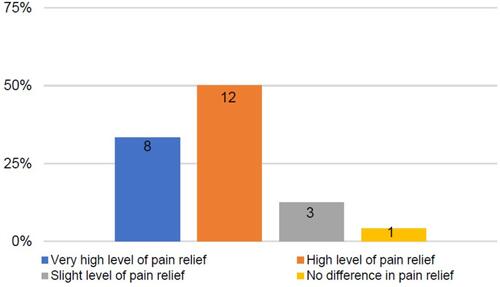
Figure 6 Time until maximal pain relief.
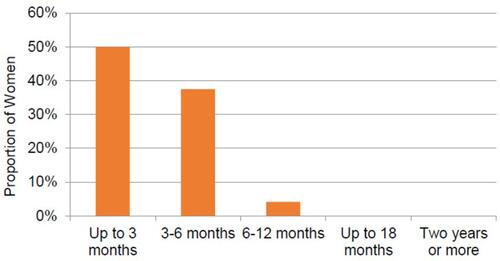
Table 2 Factors Related to Treatment Outcomes