
Figures & data
Table 1 Socio-Demographic and Obstetric Characteristics of the Study Sample (n = 195)
Table 2 Comparison of Socio-Demographic and Obstetric Variables Between the Study Groups Before the Intervention (N= 195)
Figure 1 Total sample size.
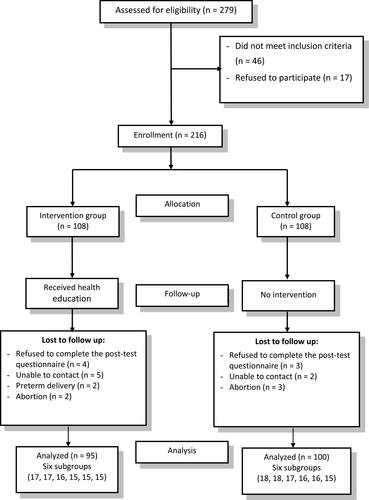
Table 3 Dietary Knowledge of Pregnant Women (n = 195)
Table 4 Independent-Samples t-Test Between the Intervention Group and the Control Group Before and After the Health Education (n = 195)
Table 5 Dietary Practices of Pregnant Women (n = 195)