
Figures & data
Figure 1 (A) Measurement of ICT, IRT, and ET. (B) Measurement of MV-E PV and MV-A PV.
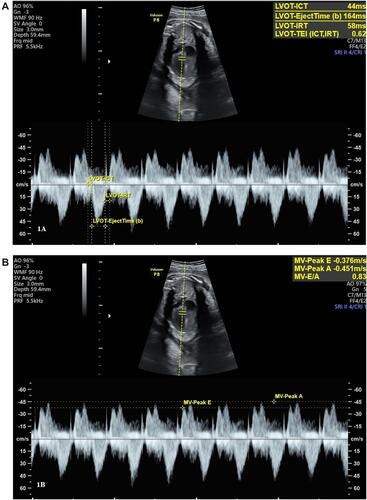
Table 1 Data Characteristics
Figure 2 Flow chart for the enrollment of study participants.
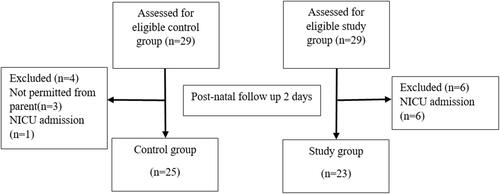
Table 2 Comparison of Fetal Cardiac Function between Preeclampsia and Normotensive Blood Pressure Groups
Figure 3 Box-plot of (A) fetal left Mod-MPI and (B) fetal right Mod-MPI in preeclampsia with or without severe features and the control groups.
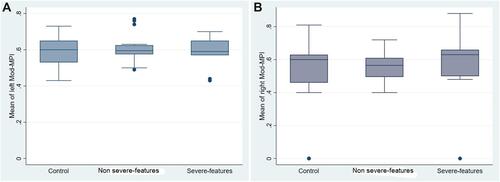
Table 3 Comparison of Neonatal Left Side Cardiac Functions between Preeclampsia and Normotensive Blood Pressure Groups