Figures & data
Table 1 Demographic and perinatal outcome data of ART pregnancies with birth defect
Table 2 Distribution of classification of cases using the EUROCAT computer algorithm according to maternal age class
Figure 1 Crude prevalence of birth defects according to maternal age, 2004–2010. (A) Prevalence per 10,000 pregnancies. (B) Prevalence per 10,000 live births.
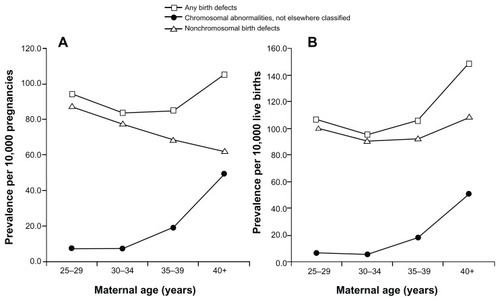
Table 3 Crude birth defect prevalence, RR, and 95% CI in ART according to maternal age class (prevalence per 10,000 pregnancies)
Table 4 Crude birth defect prevalence, RR, and 95% CI in ART according to maternal age class (prevalence per 10,000 live births)