Figures & data
Figure 1 Clinical characteristics of the enrolled patients. (A) Age distribution. (B) Cytology result. (C) HPV infection status. (D) Distribution of transformation zone type.
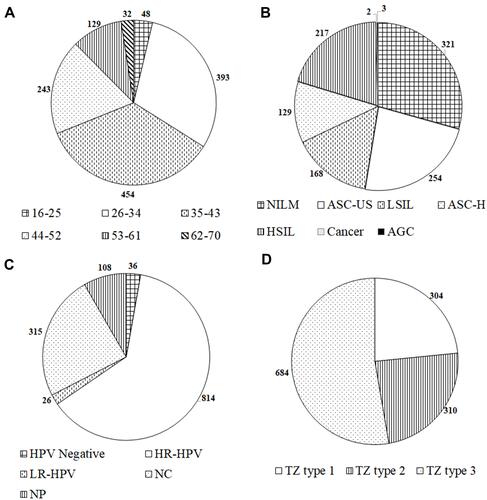
Table 1 Correlation Between Colposcopy Impression, CDB&ECC and Conization
Table 2 Diagnostic Value of Cytology Under Different Criteria in Detecting Pathologic Cervical Cancer
Table 3 Detailed Results of the “Three-Step” Screening Procedure of Occult Cervical Cancer Patients
Figure 2 Binary logistic regression results to identify risk factors for HSIL+ patients.
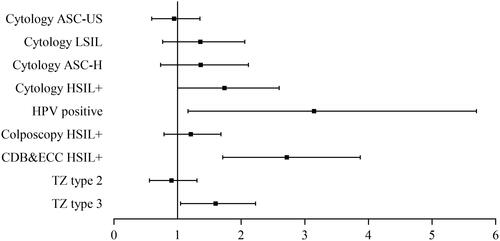
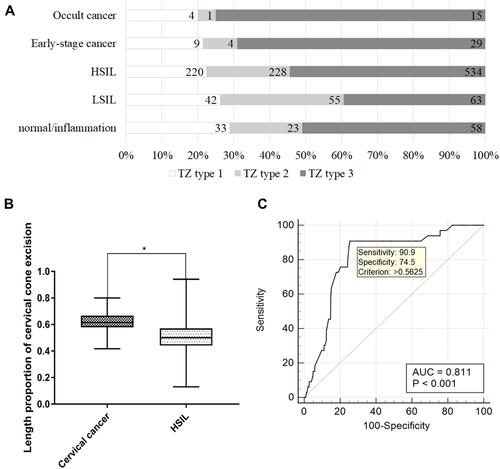
Figure 3 (A) Distribution of the transformation zone in patients with different grades of cervical lesions. (B) Difference in length proportion of cervical cone excision between cervical cancer patients and HSIL patients. *Significant difference between two groups (P < 0.05). (C) ROC curve of the length proportion of cervical cone excision in detecting cervical cancer.