Figures & data
Table 1 Clinical Co-Variates of the Training and Validation Cohorts
Figure 1 Flow chart of data collection and analysis.
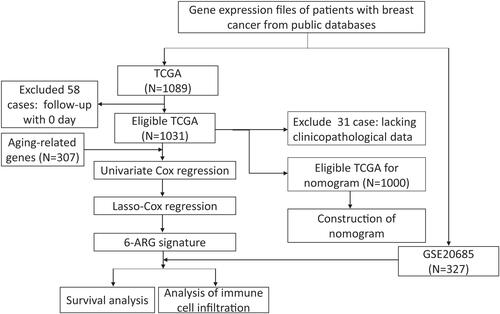
Figure 2 Identification of a prognosis-related ARG-based signature in the TCGA training cohort. (A) Selection of the optimal candidate genes in the LASSO model. (B) LASSO coefficients of prognosis-associated ARGs, each curve represents a gene. (C) Forest plots showing results of univariate Cox regression analysis between the candidate ARGs expression and overall survival.
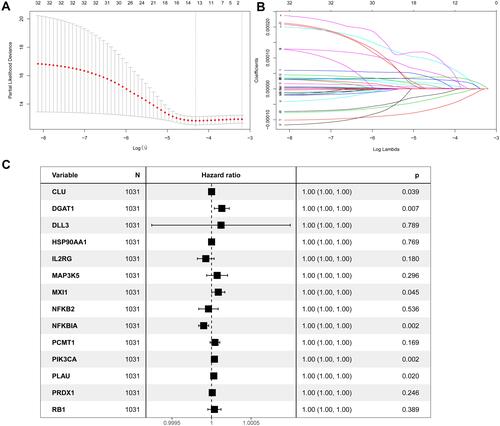
Figure 3 Assessment of prognostic value of the ARG signature model in the TCGA training cohort. (A) Determination of cut-off value of ARGs risk scores by the maximally selected Log rank statistics. (B) The distribution of risk scores in the TCGA. (C) Patient distribution in the high- and low-risk group according to overall survival status. (D) The heat map showing expression profiles of the six ARGs. (E) Kaplan–Meier curves for the overall survival of patients in the high- and low-risk group. (F) Multivariate Cox regression analysis of ARGs signature and other clinicopathological factors.
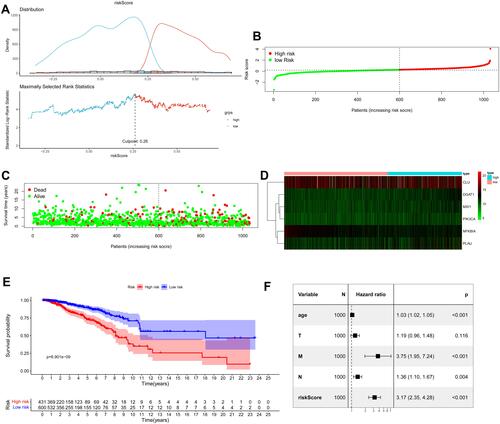
Figure 4 Assessment of prognostic value of the ARG signature model in the GSE20685 validation cohort. (A) The distribution of risk scores in the GSE20685. (B) Patient distribution in the high- and low-risk group according to overall survival status. (C) The heat map showing expression profiles of the six ARGs. (D) Kaplan–Meier curves for the overall survival of patients in the high- and low-risk group. (E) Multivariate Cox regression analysis of ARGs signature and other clinicopathological factors.
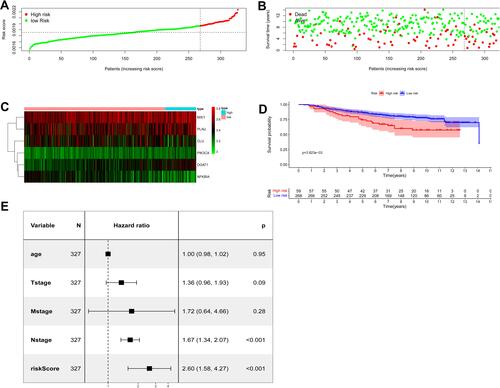
Figure 5 The landscape of immune cell infiltration between the high- and low-risk group in the TCGA training cohort. (A) Barplot of different immune cell infiltrations. (B) Heat map of the tumor-infiltrating cell proportions. (C) Correlation matrix of the association between the expression level of the six ARGs and tumor-infiltrating immune cell infiltrations. (D) Violin plot showing differences of infiltrating immune cell types between the low- and the high-risk group.
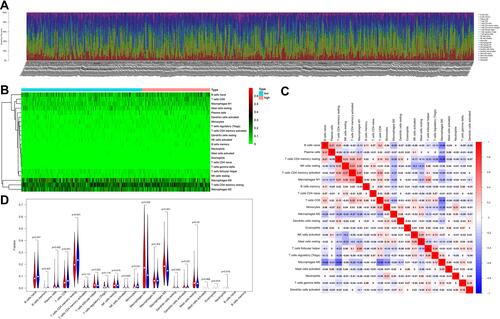
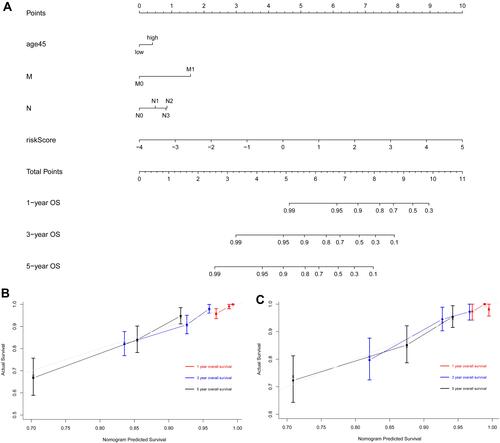
Figure 6 Development of a nomogram based on ARGs signature for predicting overall survival of patients with BC. (A) The nomogram plot integrating ARG risk score, age, N- and M-classification in the TCGA training cohort. (B) The calibration plot for the probability of 1-, 3-, and 5-year OS in the TCGA training cohort. (C) The calibration plot for the probability of 1-, 3-, and 5-year OS in the GSE20685 validation cohort.