Figures & data
Figure 1 Screening process of the samples included in the analysis.
Abbreviation: CBCT, cone beam computed tomography.

Figure 2 Measurements of the upper airway morphology and hyoid bone position. (A) Airway measurements in the median sagittal plane. (B) Reconstructed lateral cephalogram.
Abbreviations: S, central point of the sella turcica; PNS, posterior nasal spine; UT, uvula tip; EV, epiglottis valley; UV, upper airway volume; UL, upper airway length; Amin, minimum cross-sectional area of upper airway between PNS and EV; N, nasion, anterior-most point of nasofrontal suture; P, porion, uppermost point of external auditory canal; O, orbitale, lowest point of infraorbital rim; A, subspinale, most concave point of maxilla; B, supramental, most concave point of mandible; Me, menton, lowermost point of the chin; H, the superior anterior point of the hyoid bone; SN plane, S and N points lie in the line, representing the anterior cranial base plane; FH plane, Frankfort plane; MP plane, mandibular plane; ANB, the angle formed by the points A, N and B; MPH, Distance between H and MP plane.
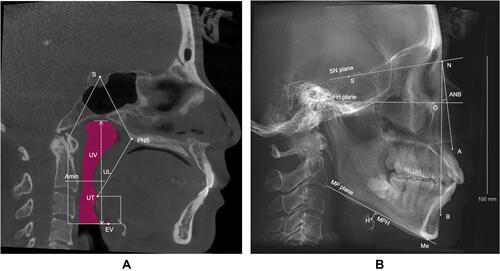
Table 1 Craniofacial Characteristics in Age Groups
Table 2 Comparison of Upper Airway Morphology Between Age Groups in Females and Males
Table 3 Changes of Upper Airway Morphology Between Adjacent Age Groups
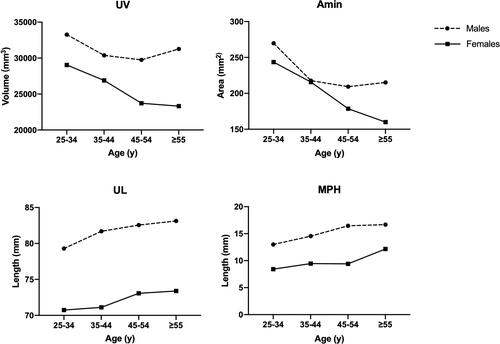
Figure 3 Upper airway morphology and hyoid position change between age groups in males and females.
Abbreviations: UV, upper airway volume; UL, upper airway length; Amin, minimum cross-sectional area of upper airway between PNS and EV; MPH, distance between H and MP plane.