Figures & data
Table 1 Distribution of eating behavior scores and physical characteristics of study participants
Figure 1 Mean scores for disinhibition and rigid and flexible restraint by BMI category (n = 275).
Notes: Scores for disinhibition ( ), rigid (
 ) and flexible restraint (
 ). Disinhibition and Rigid scores increase with increasing BMI category. Trend is statistically significant. *P < 0.001; **P < 0.05.
Abbreviation: BMI, body mass index.
Abbreviation: BMI, body mass index.
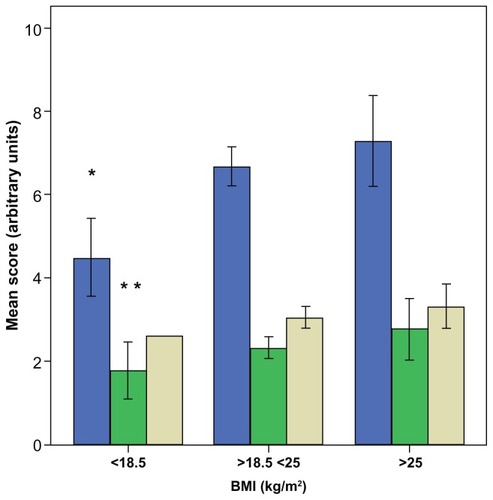
Table 2 Dieting behavior categorized by age, height, body weight, and BMI
Table 3 Prevalence of dieting behaviors in different BMI categoriesTable Footnotea,Table Footnoteb