Figures & data
Table 1 Descriptive Statistics for Study Population (N = 160)
Table 2 Pearson’s Correlation Coefficient and Intra-Class Correlation Coefficient with Bootstrap Confidence Interval
Figure 1 Scatterplot of AFI and SDP estimates based on measures perpendicular to the floor versus uterine contour.
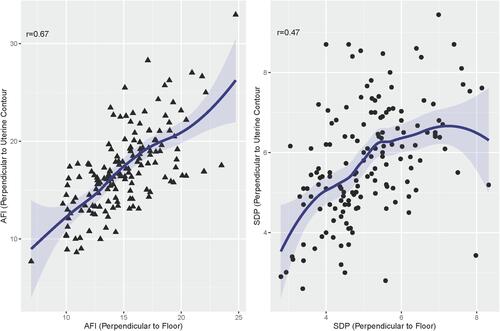
Figure 2 Bland-Altman plot for AFI, with the representation of the limits of agreements.
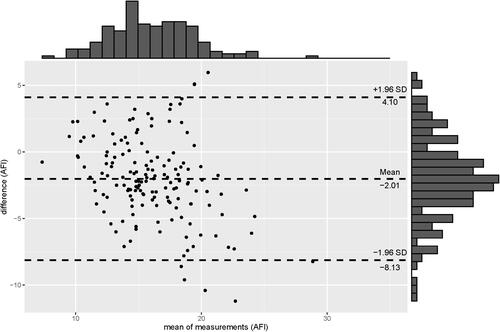
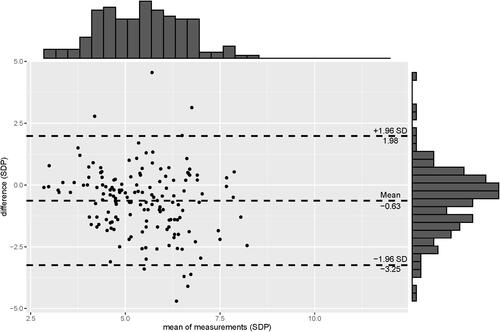
Figure 3 Bland-Altman plot for SDP, with the representation of the limits of agreements.