Figures & data
Table 1 The Most Used Generic Questionnaires to Assess the Quality of Life of Pregnant Women Between 2011 and 2021
Figure 1 Flow chart showing the methodology for selecting articles on the quality of life in pregnant women.
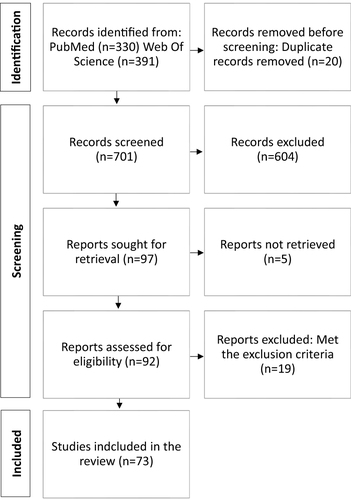
Table 2 The Summary of Studies Assessing the Quality of Life of Pregnant Women Between 2011 and 2021
Figure 2 Distribution of number of articles published per year from 18/06/2011 to 17/06/2021.
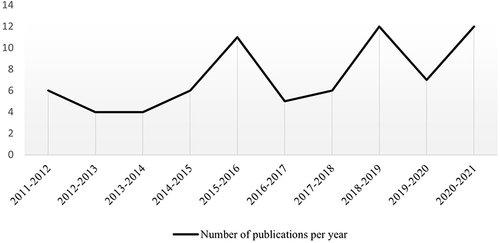
Figure 3 Geographical distribution by continent of publications dealing with the quality of life of pregnant women between 18/06/2011 and 17/06/2021.
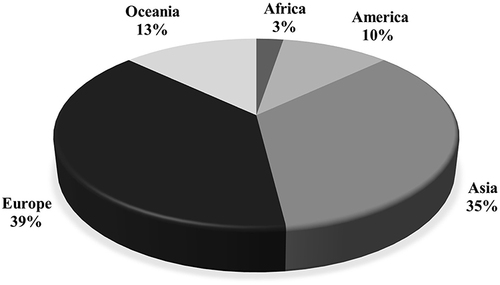
Table 3 Geographical Distribution by Country of Publications Dealing with the Quality of Life of Pregnant Women Between 18/06/2011 and 17/06/2021
Figure 4 Number of articles evaluating the quality of life in pregnancy by the category of obstetrics from 18/06/2011 to 17/06/2021.
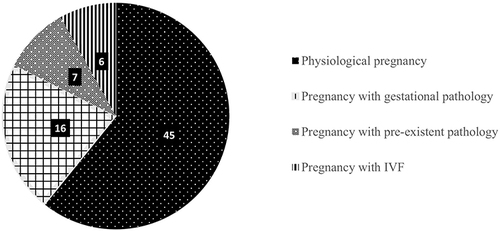
Table 4 Pathologies Studied in Relation to Quality of Life During Pregnancy
Table 5 Distribution of the Instruments of Quality of Life Used in the Review
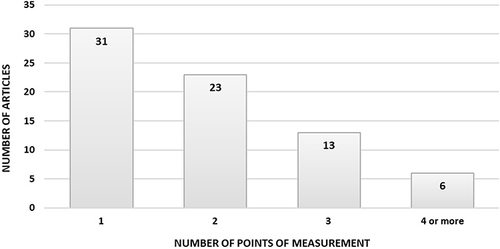
Figure 5 Number of points of measurement used to assess the quality of life during pregnancy.