
Figures & data
Figure 1 Flow chart of the study.
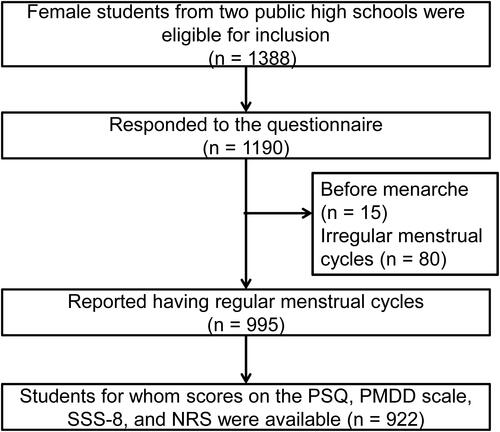
Table 1 Characteristics of the Study Participants (n = 922)
Table 2 Corrected Item-Total Correlation and Cronbach’S α if Item is Deleted for the PSQ and PSQ-S
Figure 2 Scree plot for the PSQ-S.
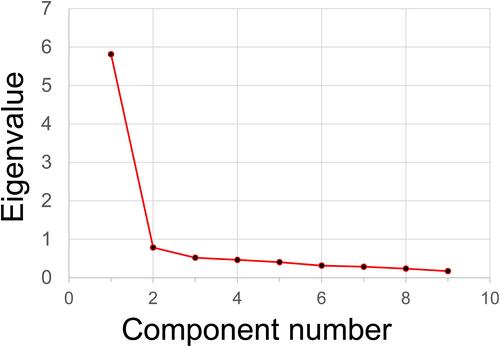
Table 3 Goodness-of-Fit Summary of the PSQ-S and the PSQ
Figure 3 One-factor model of the PSQ-S (A) and the PSQ (B) and standardized parameter estimates.
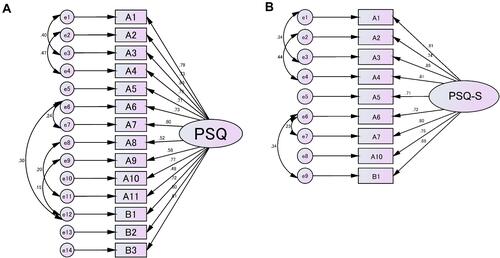
Table 4 Correlation Coefficients for the PSQ-S, the PSQ, the PMDD Scale, the SSS-8, and the NRS
Table 5 IRT Parameter of the PSQ and the PSQ-S
Figure 4 Item characteristic curves for the PSQ-S. Theta at the horizontal axis indicates the trait level (severity of premenstrual symptoms). The vertical axis shows the probability for an answer in each of the PSQ-S questionnaire items. Four curves (from 1 to 4) indicate each possible response: curve 1, not at all; curve 2, mild; curve 3, moderate; curve 4, severe. Curve 1, the leftmost curve, shows the probability that each individual would choose 1 out of 4 ratings at different trait levels. The curve shows that the lower the trait level, the higher the probability of choosing 1. Curve 4, the rightmost curve, shows the probability that each individual would choose 4 out of 4 ratings at different trait levels. The curve shows that the higher the trait level, the higher the probability of choosing 4. Curves 2 and 3 between them are unimodal, indicating that at a certain range of trait levels, 2 or 3 is chosen.
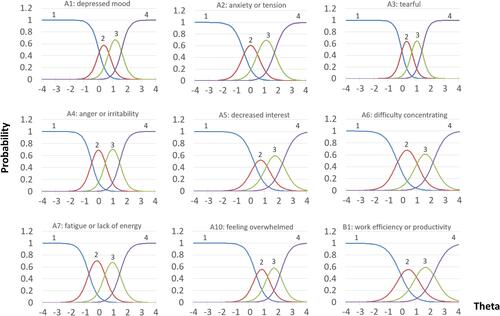
Figure 5 Item information curves for the PSQ-S. Theta at the horizontal axis indicates the trait level (severity of premenstrual symptoms). The vertical axis shows the amount of information for an answer in each of the PSQ-S questionnaire items. The higher the curve, the greater the amount of information in a narrower range of trait levels and, consequently, the more highly discriminating the item is. On the other hand, items with low discrimination power show a flat curve across a wide range of trait levels, which means that they are less informative.
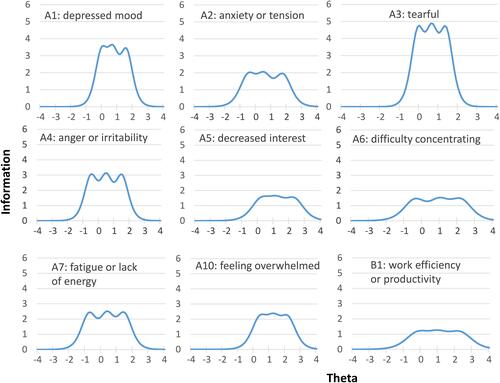
Figure 6 Test information curve and standard error of measurement for the PSQ and PSQ-S. Theta at the horizontal axis indicates the trait level (severity of premenstrual symptoms). The vertical axis shows the amount of summative test information for the PSQ and the PSQ-S.
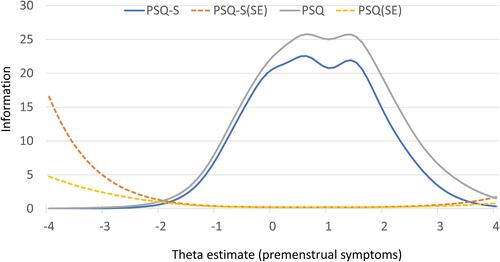
Table 6 AUC of the ROC Analysis for the PSQ-S