Figures & data
Figure 1 Treatment schedule.
Abbreviations: drsp, drospirenone; EE, ethinylestradiol; HFI, hormone-free interval.
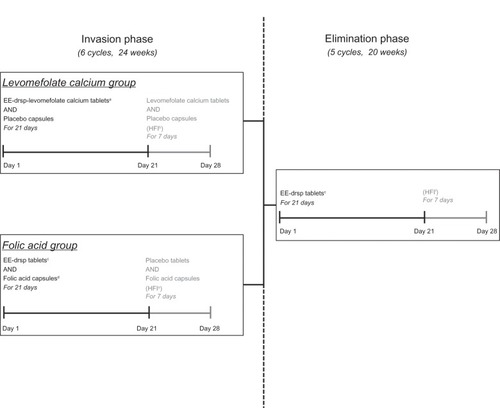
Figure 2 Disposition of women throughout the study.
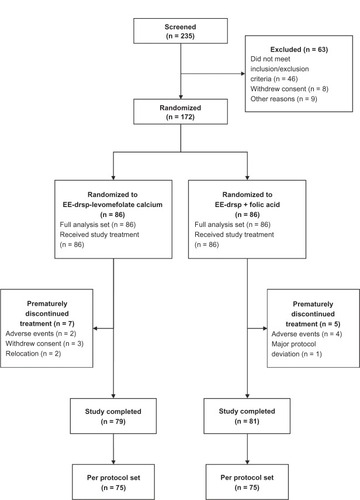
Table 1 Baseline and demographic characteristics of study participants (per protocol set)
Table 2 Area under the folate concentration-time curve from time 0 (baseline) to week 24 (AUC(0–24 weeks)) for plasma and RBC folate (uncorrected and corrected for baseline folate concentrations) after administration of EE-drospirenone-levomefolate calcium or EE-drospirenone + folic acid for 24 weeks (invasion phase; per protocol set)
Figure 3 Concentration-time curves for plasma folate during 24 weeks of treatment with EE-drospirenone-levomefolate calcium or EE-drospirenone + folic acid (invasion phase) and during the 20-week period following cessation of treatment (elimination phase; per protocol set).
Abbreviations: drsp, drospirenone; EE, ethinylestradiol.
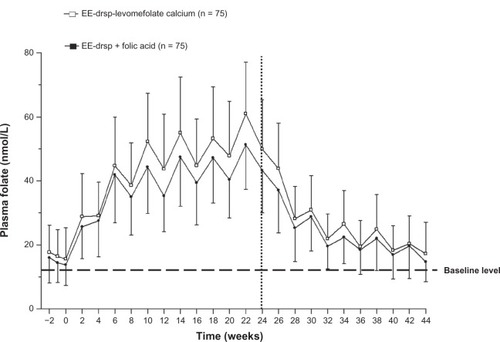
Figure 4 Concentration-time curves for RBC folate during 24 weeks of treatment with EE-drospirenone-levomefolate calcium or EE-drospirenone + folic acid (invasion phase) and during the 20-week period following cessation of treatment (elimination phase; per protocol set).
Abbreviations: drsp, drospirenone; EE, ethinylestradiol; RBC, red blood cell.
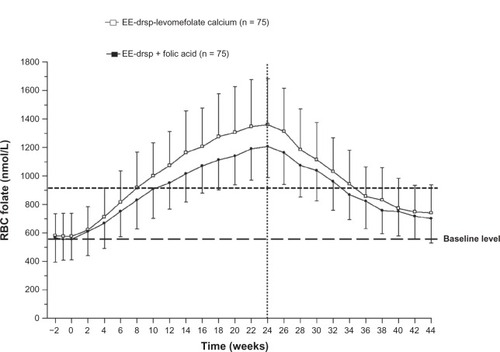
Table 3 Proportion of women (cumulative) with plasma and RBC folate levels below the mean median baseline value, and with homocysteine levels above the mean median baseline value in the 20-week period following the cessation of 24 weeks of treatment with EE-drospirenone-levomefolate calcium or EE-drospirenone + folic acid (per protocol set)
Figure 5 Kaplan–Meier estimates for time to RBC folate levels falling below 906 nmol/L for EE-drospirenone following treatment with EE-drospirenone-levomefolate calcium (per protocol set).
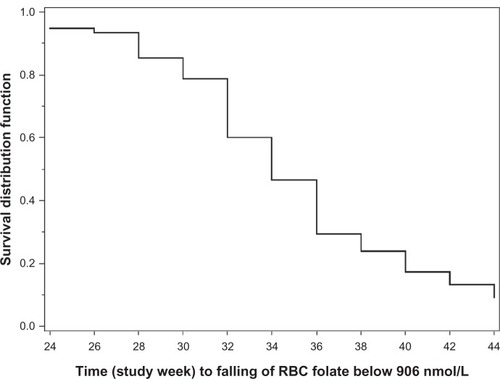
Figure 6 Distribution of individual L-MTHF plasma concentrations [nmol/L] at baseline (visit 1), week 12 (visit 8), and week 24 (visit 14) after daily oral administration of EE-drospirenone-levomefolate calcium (MTHF) or EE-drospirenone + FA.
Abbreviations: EE, ethinylestradiol; FA, folic acid; L-MTHF, L-5-methyl-tetrahydrofolate.
![Figure 6 Distribution of individual L-MTHF plasma concentrations [nmol/L] at baseline (visit 1), week 12 (visit 8), and week 24 (visit 14) after daily oral administration of EE-drospirenone-levomefolate calcium (MTHF) or EE-drospirenone + FA.](/cms/asset/4dc93d78-9981-4482-8212-6ce3dcb08457/djwh_a_37254_f0006_b.jpg)
Figure 7 Percentages of metabolite values below lower limit of quantification at baseline (visit 1), week 12 (visit 8), and week 24 (visit 14) after daily oral administration of EE-drospirenone-levomefolate calcium (MTHF) and EE-drospirenone + FA.
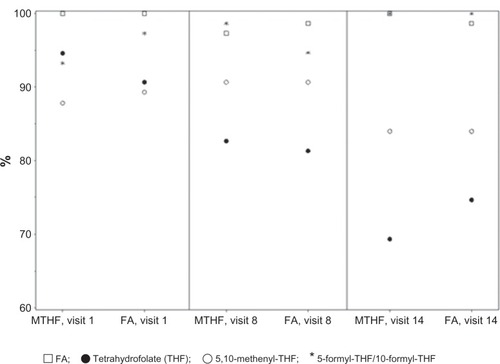
Table 4 Mean metabolite concentrations in plasma (nmol/L)
Table 5 Adverse events during the invasion phase, elimination phase, and the overall study (invasion + elimination phase)