Figures & data
Figure 1 Subject screening (flow chart for target group selection). Database 1: Women aged 24 to 49 years living in Japan who suffer from PMS among the subjects selected by the gut microbiota examination and analysis services offered by Symbiosis Solutions. Database 2: Women aged 24 to 49 years in the same age range as those with PMS among the data analyzed by the Japan Agricultural Frontier Development Organization.
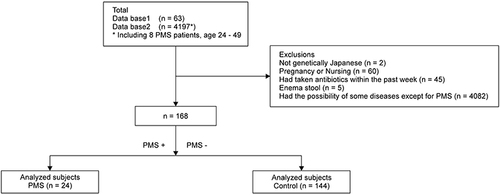
Table 1 Overview of Analysis Target Groups
Figure 2 Comparison between the α-diversity of the PMS and control groups. Boxplot calculated using the Simpson indices of the two groups. Each plot shows outliers. A significant difference was observed between the groups at p <0.05.
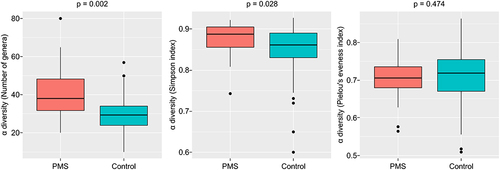
Figure 3 Comparison between the β-diversity of the PMS and control groups. The distance of the gut microbiota between the two groups was visualized using the NMDS method (stress = 0.240). Distances between samples were calculated using the Bray-Curtis index. A significant difference was observed between the groups at p <0.001 (dispersion=0.537).
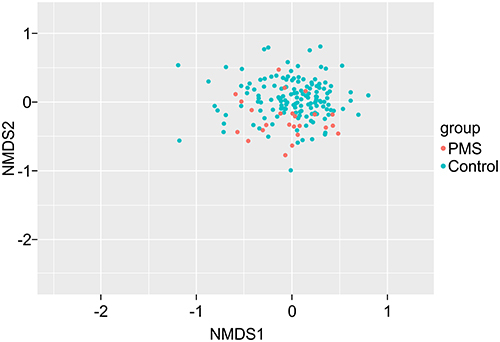
Table 2 Comparison of the Top 20 Bacteria Based on the Relative Abundance in the PMS and Control Groups
Figure 4 Significant differences in the gut microbial abundance at the genus level between the PMS and control groups. Genera whose absolute value of effect size calculated using the ALDEx2 pipeline was 0.2 or higher. The positive and negative effect sizes are the genera with high abundance in the PMS and control groups, respectively.
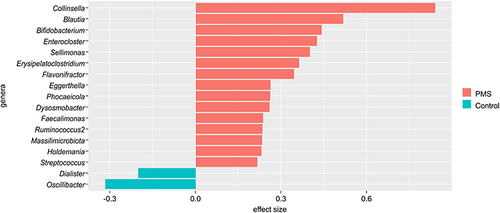
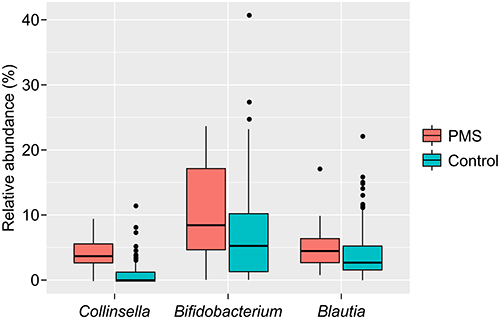
Figure 5 Box plot showing the genera with significant differences in abundance between the PMS and the control groups. The vertical axis shows the relative abundance, and each plot shows the outliers.